Immigrants from Ireland vs Immigrants from Sri Lanka Single Mother Poverty
COMPARE
Immigrants from Ireland
Immigrants from Sri Lanka
Single Mother Poverty
Single Mother Poverty Comparison
Immigrants from Ireland
Immigrants from Sri Lanka
25.8%
SINGLE MOTHER POVERTY
100.0/ 100
METRIC RATING
15th/ 347
METRIC RANK
26.3%
SINGLE MOTHER POVERTY
100.0/ 100
METRIC RATING
26th/ 347
METRIC RANK
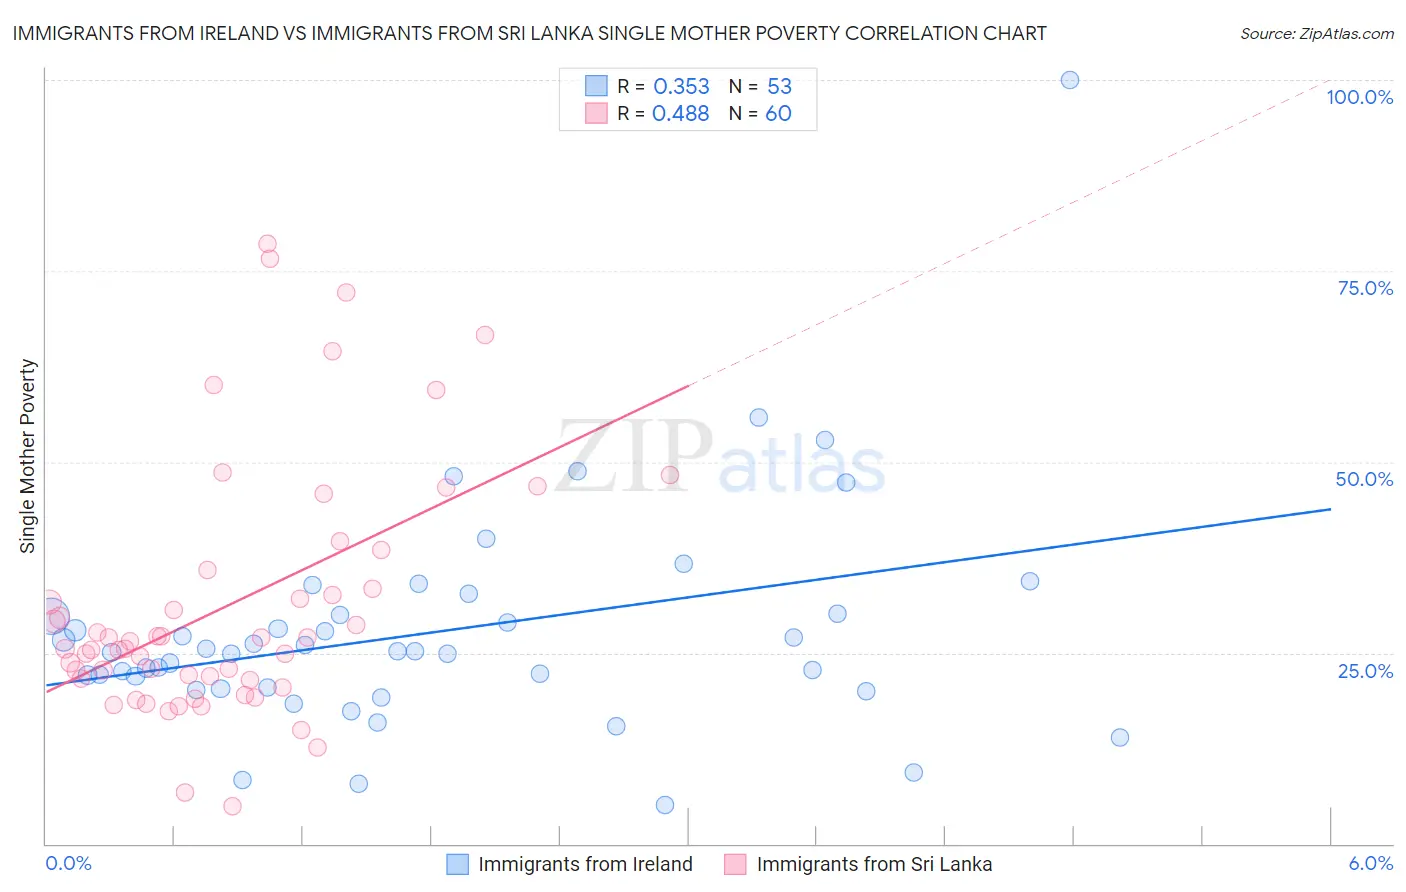
Immigrants from Ireland vs Immigrants from Sri Lanka Single Mother Poverty Correlation Chart
The statistical analysis conducted on geographies consisting of 234,765,496 people shows a mild positive correlation between the proportion of Immigrants from Ireland and poverty level among single mothers in the United States with a correlation coefficient (R) of 0.353 and weighted average of 25.8%. Similarly, the statistical analysis conducted on geographies consisting of 147,892,421 people shows a moderate positive correlation between the proportion of Immigrants from Sri Lanka and poverty level among single mothers in the United States with a correlation coefficient (R) of 0.488 and weighted average of 26.3%, a difference of 1.9%.
Single Mother Poverty Correlation Summary
| Measurement | Immigrants from Ireland | Immigrants from Sri Lanka |
| Minimum | 5.0% | 4.9% |
| Maximum | 100.0% | 78.5% |
| Range | 95.0% | 73.6% |
| Mean | 27.7% | 31.2% |
| Median | 25.2% | 26.0% |
| Interquartile 25% (IQ1) | 20.3% | 21.6% |
| Interquartile 75% (IQ3) | 30.0% | 34.6% |
| Interquartile Range (IQR) | 9.7% | 13.0% |
| Standard Deviation (Sample) | 14.7% | 16.5% |
| Standard Deviation (Population) | 14.5% | 16.3% |
Demographics Similar to Immigrants from Ireland and Immigrants from Sri Lanka by Single Mother Poverty
In terms of single mother poverty, the demographic groups most similar to Immigrants from Ireland are Immigrants from Singapore (25.8%, a difference of 0.18%), Bolivian (25.9%, a difference of 0.29%), Indian (Asian) (25.8%, a difference of 0.34%), Asian (26.0%, a difference of 0.47%), and Immigrants from Pakistan (26.0%, a difference of 0.75%). Similarly, the demographic groups most similar to Immigrants from Sri Lanka are Immigrants from Asia (26.3%, a difference of 0.13%), Immigrants from Japan (26.4%, a difference of 0.22%), Korean (26.4%, a difference of 0.24%), Jordanian (26.4%, a difference of 0.29%), and Immigrants from Moldova (26.2%, a difference of 0.32%).
| Demographics | Rating | Rank | Single Mother Poverty |
| Immigrants | South Central Asia | 100.0 /100 | #10 | Exceptional 25.3% |
| Iranians | 100.0 /100 | #11 | Exceptional 25.5% |
| Bhutanese | 100.0 /100 | #12 | Exceptional 25.6% |
| Indians (Asian) | 100.0 /100 | #13 | Exceptional 25.8% |
| Immigrants | Singapore | 100.0 /100 | #14 | Exceptional 25.8% |
| Immigrants | Ireland | 100.0 /100 | #15 | Exceptional 25.8% |
| Bolivians | 100.0 /100 | #16 | Exceptional 25.9% |
| Asians | 100.0 /100 | #17 | Exceptional 26.0% |
| Immigrants | Pakistan | 100.0 /100 | #18 | Exceptional 26.0% |
| Immigrants | Eastern Asia | 100.0 /100 | #19 | Exceptional 26.1% |
| Immigrants | China | 100.0 /100 | #20 | Exceptional 26.1% |
| Immigrants | Bolivia | 100.0 /100 | #21 | Exceptional 26.2% |
| Immigrants | Korea | 100.0 /100 | #22 | Exceptional 26.2% |
| Burmese | 100.0 /100 | #23 | Exceptional 26.2% |
| Immigrants | Moldova | 100.0 /100 | #24 | Exceptional 26.2% |
| Immigrants | Asia | 100.0 /100 | #25 | Exceptional 26.3% |
| Immigrants | Sri Lanka | 100.0 /100 | #26 | Exceptional 26.3% |
| Immigrants | Japan | 100.0 /100 | #27 | Exceptional 26.4% |
| Koreans | 100.0 /100 | #28 | Exceptional 26.4% |
| Jordanians | 100.0 /100 | #29 | Exceptional 26.4% |
| Turks | 100.0 /100 | #30 | Exceptional 26.4% |