Immigrants from Iran vs South African Married-couple Households
COMPARE
Immigrants from Iran
South African
Married-couple Households
Married-couple Households Comparison
Immigrants from Iran
South Africans
48.8%
MARRIED-COUPLE HOUSEHOLDS
99.6/ 100
METRIC RATING
43rd/ 347
METRIC RANK
47.3%
MARRIED-COUPLE HOUSEHOLDS
86.4/ 100
METRIC RATING
133rd/ 347
METRIC RANK
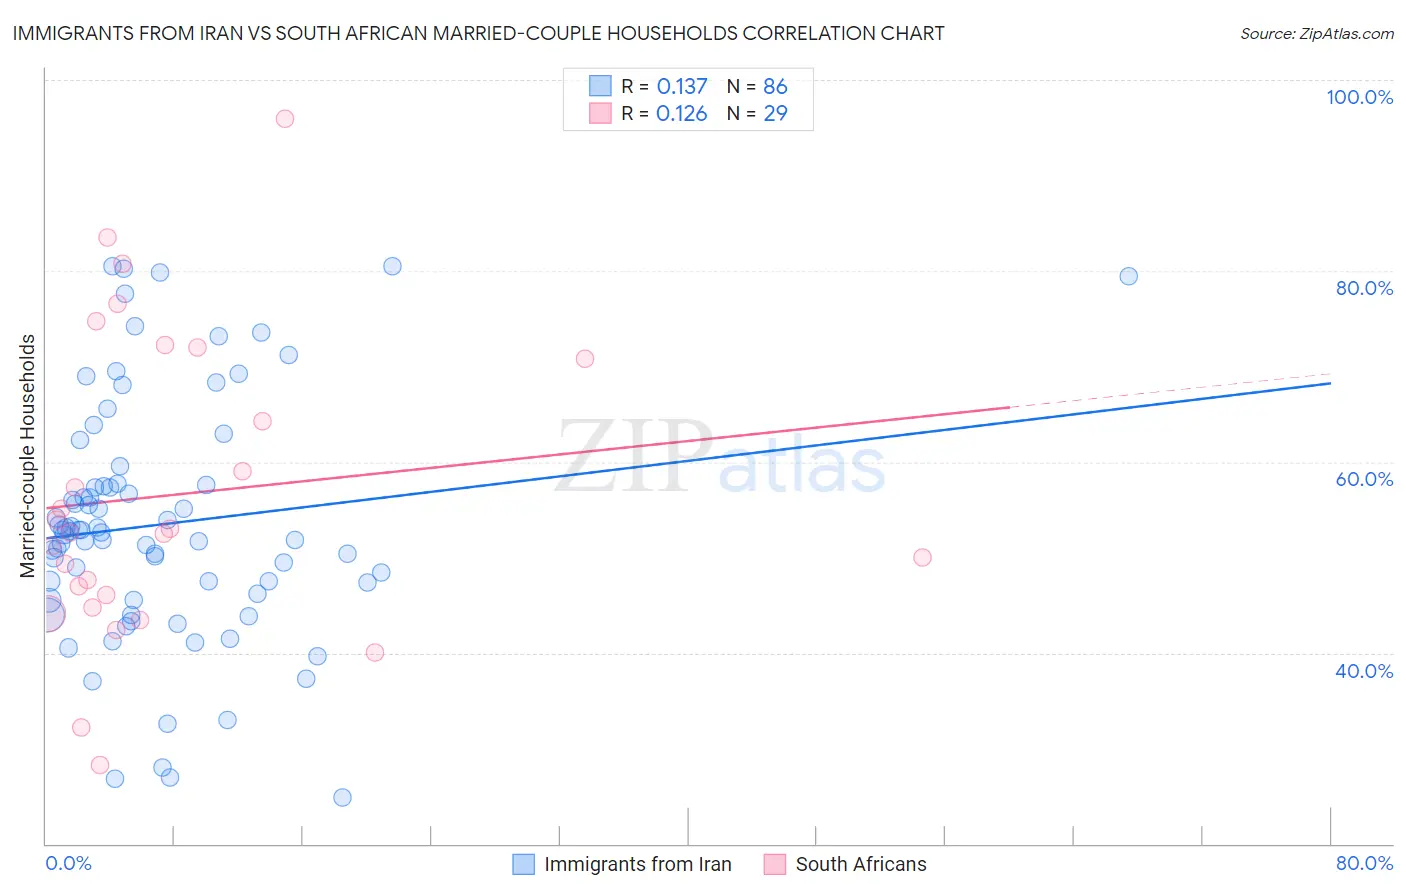
Immigrants from Iran vs South African Married-couple Households Correlation Chart
The statistical analysis conducted on geographies consisting of 279,826,479 people shows a poor positive correlation between the proportion of Immigrants from Iran and percentage of married-couple family households in the United States with a correlation coefficient (R) of 0.137 and weighted average of 48.8%. Similarly, the statistical analysis conducted on geographies consisting of 182,537,045 people shows a poor positive correlation between the proportion of South Africans and percentage of married-couple family households in the United States with a correlation coefficient (R) of 0.126 and weighted average of 47.3%, a difference of 3.3%.
Married-couple Households Correlation Summary
| Measurement | Immigrants from Iran | South African |
| Minimum | 24.8% | 28.3% |
| Maximum | 80.5% | 96.0% |
| Range | 55.7% | 67.7% |
| Mean | 53.5% | 56.6% |
| Median | 52.7% | 52.6% |
| Interquartile 25% (IQ1) | 46.2% | 45.4% |
| Interquartile 75% (IQ3) | 57.6% | 71.4% |
| Interquartile Range (IQR) | 11.3% | 26.0% |
| Standard Deviation (Sample) | 12.6% | 16.0% |
| Standard Deviation (Population) | 12.6% | 15.7% |
Similar Demographics by Married-couple Households
Demographics Similar to Immigrants from Iran by Married-couple Households
In terms of married-couple households, the demographic groups most similar to Immigrants from Iran are Welsh (48.8%, a difference of 0.050%), Immigrants from Vietnam (48.8%, a difference of 0.060%), Immigrants from Eastern Asia (48.8%, a difference of 0.080%), Immigrants from Lebanon (48.9%, a difference of 0.10%), and Tsimshian (48.7%, a difference of 0.13%).
| Demographics | Rating | Rank | Married-couple Households |
| Iranians | 99.7 /100 | #36 | Exceptional 49.0% |
| Sri Lankans | 99.7 /100 | #37 | Exceptional 49.0% |
| Greeks | 99.7 /100 | #38 | Exceptional 48.9% |
| Lithuanians | 99.6 /100 | #39 | Exceptional 48.9% |
| Immigrants | Bolivia | 99.6 /100 | #40 | Exceptional 48.9% |
| Immigrants | Lebanon | 99.6 /100 | #41 | Exceptional 48.9% |
| Immigrants | Vietnam | 99.6 /100 | #42 | Exceptional 48.8% |
| Immigrants | Iran | 99.6 /100 | #43 | Exceptional 48.8% |
| Welsh | 99.5 /100 | #44 | Exceptional 48.8% |
| Immigrants | Eastern Asia | 99.5 /100 | #45 | Exceptional 48.8% |
| Tsimshian | 99.5 /100 | #46 | Exceptional 48.7% |
| British | 99.5 /100 | #47 | Exceptional 48.7% |
| Indians (Asian) | 99.4 /100 | #48 | Exceptional 48.7% |
| Immigrants | Sri Lanka | 99.4 /100 | #49 | Exceptional 48.7% |
| Samoans | 99.4 /100 | #50 | Exceptional 48.7% |
Demographics Similar to South Africans by Married-couple Households
In terms of married-couple households, the demographic groups most similar to South Africans are Immigrants from Ukraine (47.3%, a difference of 0.020%), Immigrants from Greece (47.2%, a difference of 0.040%), Immigrants from Argentina (47.2%, a difference of 0.040%), Immigrants from Denmark (47.3%, a difference of 0.090%), and New Zealander (47.2%, a difference of 0.090%).
| Demographics | Rating | Rank | Married-couple Households |
| Pakistanis | 88.6 /100 | #126 | Excellent 47.3% |
| Celtics | 88.1 /100 | #127 | Excellent 47.3% |
| Immigrants | Peru | 87.9 /100 | #128 | Excellent 47.3% |
| Immigrants | Iraq | 87.8 /100 | #129 | Excellent 47.3% |
| Immigrants | Hungary | 87.8 /100 | #130 | Excellent 47.3% |
| Immigrants | Denmark | 87.5 /100 | #131 | Excellent 47.3% |
| Immigrants | Ukraine | 86.7 /100 | #132 | Excellent 47.3% |
| South Africans | 86.4 /100 | #133 | Excellent 47.3% |
| Immigrants | Greece | 86.0 /100 | #134 | Excellent 47.2% |
| Immigrants | Argentina | 86.0 /100 | #135 | Excellent 47.2% |
| New Zealanders | 85.3 /100 | #136 | Excellent 47.2% |
| Immigrants | Malaysia | 85.2 /100 | #137 | Excellent 47.2% |
| Immigrants | Afghanistan | 85.1 /100 | #138 | Excellent 47.2% |
| Immigrants | Sweden | 84.7 /100 | #139 | Excellent 47.2% |
| Spanish | 84.5 /100 | #140 | Excellent 47.2% |