Immigrants from India vs Somali No Schooling Completed
COMPARE
Immigrants from India
Somali
No Schooling Completed
No Schooling Completed Comparison
Immigrants from India
Somalis
1.7%
NO SCHOOLING COMPLETED
99.4/ 100
METRIC RATING
73rd/ 347
METRIC RANK
2.9%
NO SCHOOLING COMPLETED
0.0/ 100
METRIC RATING
303rd/ 347
METRIC RANK
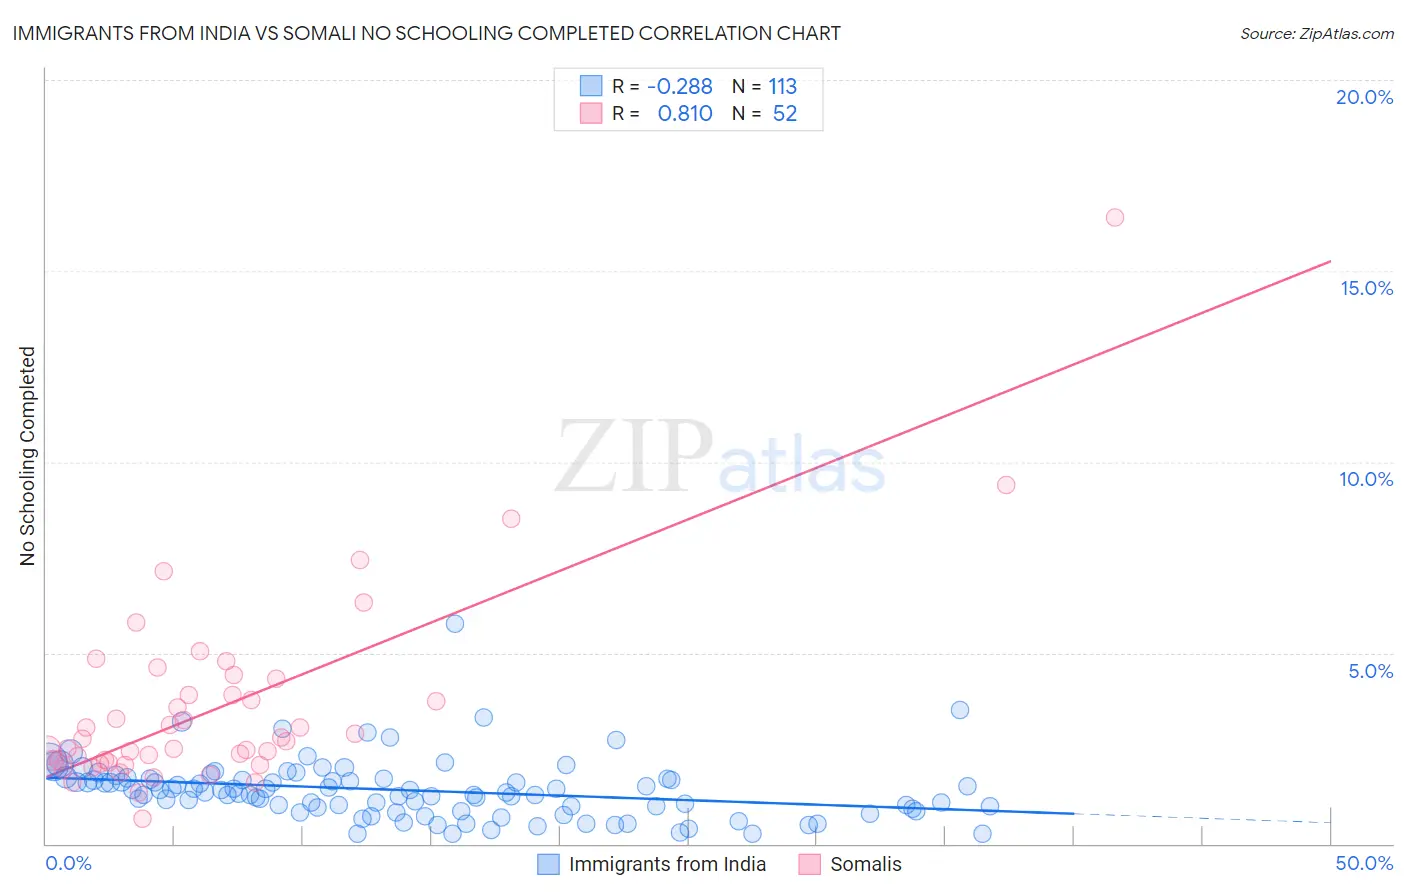
Immigrants from India vs Somali No Schooling Completed Correlation Chart
The statistical analysis conducted on geographies consisting of 429,114,118 people shows a weak negative correlation between the proportion of Immigrants from India and percentage of population with no schooling in the United States with a correlation coefficient (R) of -0.288 and weighted average of 1.7%. Similarly, the statistical analysis conducted on geographies consisting of 99,157,968 people shows a very strong positive correlation between the proportion of Somalis and percentage of population with no schooling in the United States with a correlation coefficient (R) of 0.810 and weighted average of 2.9%, a difference of 69.9%.
No Schooling Completed Correlation Summary
| Measurement | Immigrants from India | Somali |
| Minimum | 0.25% | 0.66% |
| Maximum | 5.8% | 16.4% |
| Range | 5.5% | 15.8% |
| Mean | 1.4% | 3.6% |
| Median | 1.4% | 2.7% |
| Interquartile 25% (IQ1) | 0.94% | 2.2% |
| Interquartile 75% (IQ3) | 1.7% | 4.1% |
| Interquartile Range (IQR) | 0.75% | 2.0% |
| Standard Deviation (Sample) | 0.79% | 2.6% |
| Standard Deviation (Population) | 0.78% | 2.5% |
Similar Demographics by No Schooling Completed
Demographics Similar to Immigrants from India by No Schooling Completed
In terms of no schooling completed, the demographic groups most similar to Immigrants from India are Zimbabwean (1.7%, a difference of 0.020%), Cajun (1.7%, a difference of 0.48%), Immigrants from Belgium (1.7%, a difference of 0.60%), Immigrants from England (1.7%, a difference of 0.65%), and Cherokee (1.7%, a difference of 0.65%).
| Demographics | Rating | Rank | No Schooling Completed |
| Canadians | 99.7 /100 | #66 | Exceptional 1.7% |
| Immigrants | Austria | 99.7 /100 | #67 | Exceptional 1.7% |
| Immigrants | Lithuania | 99.7 /100 | #68 | Exceptional 1.7% |
| Chickasaw | 99.6 /100 | #69 | Exceptional 1.7% |
| Immigrants | Netherlands | 99.6 /100 | #70 | Exceptional 1.7% |
| Immigrants | England | 99.5 /100 | #71 | Exceptional 1.7% |
| Cajuns | 99.5 /100 | #72 | Exceptional 1.7% |
| Immigrants | India | 99.4 /100 | #73 | Exceptional 1.7% |
| Zimbabweans | 99.4 /100 | #74 | Exceptional 1.7% |
| Immigrants | Belgium | 99.3 /100 | #75 | Exceptional 1.7% |
| Cherokee | 99.3 /100 | #76 | Exceptional 1.7% |
| Immigrants | Sweden | 99.3 /100 | #77 | Exceptional 1.7% |
| Delaware | 99.3 /100 | #78 | Exceptional 1.7% |
| Macedonians | 99.3 /100 | #79 | Exceptional 1.7% |
| Cypriots | 99.3 /100 | #80 | Exceptional 1.7% |
Demographics Similar to Somalis by No Schooling Completed
In terms of no schooling completed, the demographic groups most similar to Somalis are Nicaraguan (2.9%, a difference of 0.19%), Ecuadorian (3.0%, a difference of 0.66%), Immigrants from Caribbean (2.9%, a difference of 0.99%), Immigrants from South Eastern Asia (2.9%, a difference of 1.4%), and Belizean (3.0%, a difference of 2.3%).
| Demographics | Rating | Rank | No Schooling Completed |
| Immigrants | Immigrants | 0.0 /100 | #296 | Tragic 2.8% |
| Immigrants | Cuba | 0.0 /100 | #297 | Tragic 2.8% |
| Immigrants | Dominica | 0.0 /100 | #298 | Tragic 2.8% |
| Central American Indians | 0.0 /100 | #299 | Tragic 2.8% |
| Haitians | 0.0 /100 | #300 | Tragic 2.9% |
| Immigrants | South Eastern Asia | 0.0 /100 | #301 | Tragic 2.9% |
| Immigrants | Caribbean | 0.0 /100 | #302 | Tragic 2.9% |
| Somalis | 0.0 /100 | #303 | Tragic 2.9% |
| Nicaraguans | 0.0 /100 | #304 | Tragic 2.9% |
| Ecuadorians | 0.0 /100 | #305 | Tragic 3.0% |
| Belizeans | 0.0 /100 | #306 | Tragic 3.0% |
| Immigrants | Haiti | 0.0 /100 | #307 | Tragic 3.0% |
| Immigrants | Somalia | 0.0 /100 | #308 | Tragic 3.0% |
| Hispanics or Latinos | 0.0 /100 | #309 | Tragic 3.0% |
| Guyanese | 0.0 /100 | #310 | Tragic 3.0% |