Immigrants from Hong Kong vs Arab 2 or more Vehicles in Household
COMPARE
Immigrants from Hong Kong
Arab
2 or more Vehicles in Household
2 or more Vehicles in Household Comparison
Immigrants from Hong Kong
Arabs
52.6%
2 OR MORE VEHICLES IN HOUSEHOLD
0.6/ 100
METRIC RATING
257th/ 347
METRIC RANK
55.0%
2 OR MORE VEHICLES IN HOUSEHOLD
35.9/ 100
METRIC RATING
185th/ 347
METRIC RANK
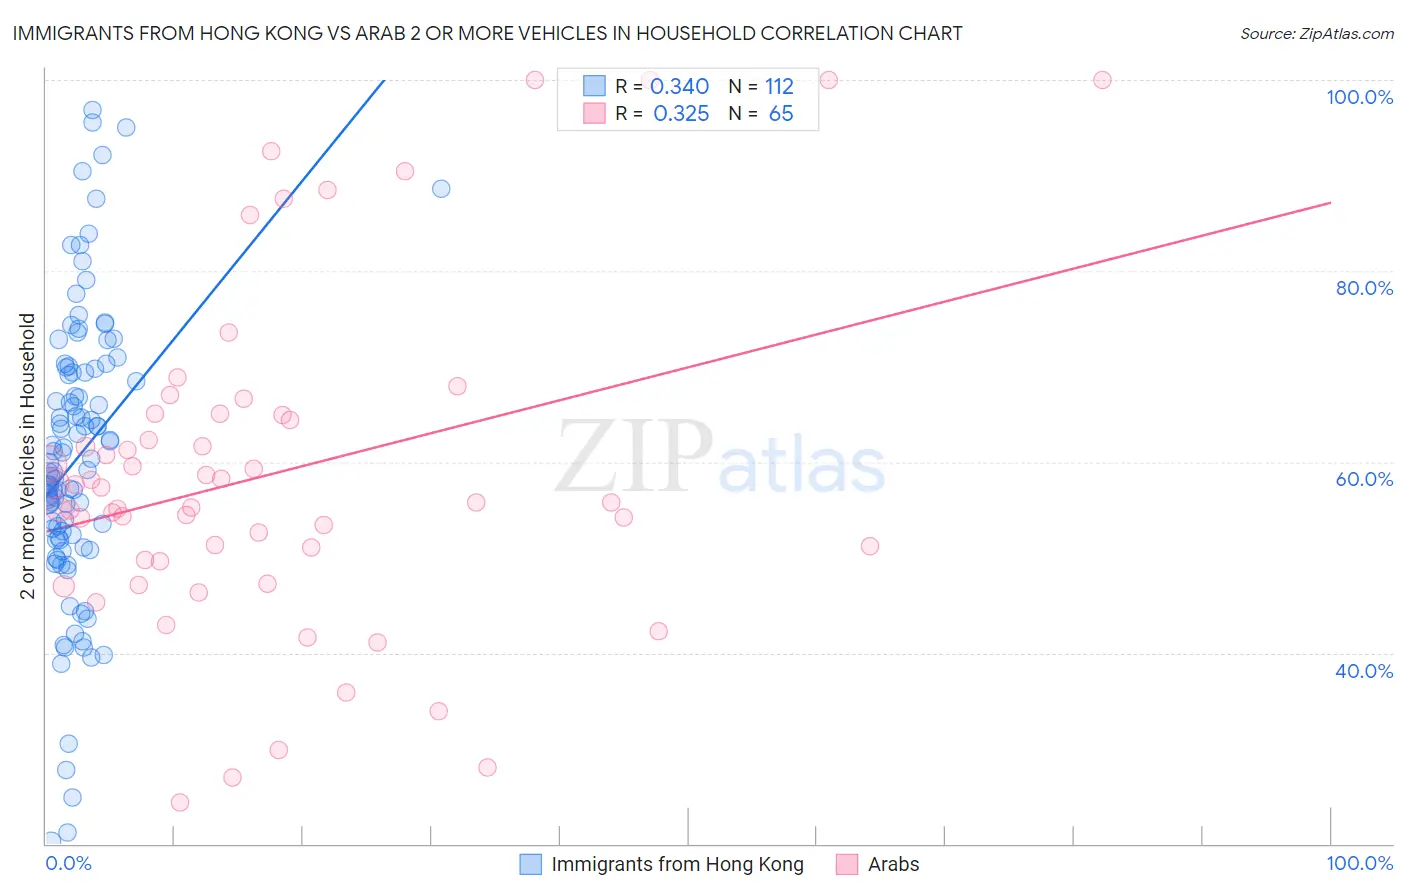
Immigrants from Hong Kong vs Arab 2 or more Vehicles in Household Correlation Chart
The statistical analysis conducted on geographies consisting of 253,902,062 people shows a mild positive correlation between the proportion of Immigrants from Hong Kong and percentage of households with 2 or more vehicles available in the United States with a correlation coefficient (R) of 0.340 and weighted average of 52.6%. Similarly, the statistical analysis conducted on geographies consisting of 486,450,180 people shows a mild positive correlation between the proportion of Arabs and percentage of households with 2 or more vehicles available in the United States with a correlation coefficient (R) of 0.325 and weighted average of 55.0%, a difference of 4.7%.
2 or more Vehicles in Household Correlation Summary
| Measurement | Immigrants from Hong Kong | Arab |
| Minimum | 20.2% | 24.3% |
| Maximum | 96.9% | 100.0% |
| Range | 76.6% | 75.7% |
| Mean | 60.4% | 58.8% |
| Median | 59.5% | 55.8% |
| Interquartile 25% (IQ1) | 52.0% | 49.7% |
| Interquartile 75% (IQ3) | 69.6% | 64.9% |
| Interquartile Range (IQR) | 17.6% | 15.2% |
| Standard Deviation (Sample) | 15.1% | 17.5% |
| Standard Deviation (Population) | 15.0% | 17.4% |
Similar Demographics by 2 or more Vehicles in Household
Demographics Similar to Immigrants from Hong Kong by 2 or more Vehicles in Household
In terms of 2 or more vehicles in household, the demographic groups most similar to Immigrants from Hong Kong are Central American Indian (52.5%, a difference of 0.10%), Immigrants from Eritrea (52.6%, a difference of 0.14%), Alsatian (52.5%, a difference of 0.14%), Uruguayan (52.7%, a difference of 0.18%), and Immigrants from Bahamas (52.5%, a difference of 0.20%).
| Demographics | Rating | Rank | 2 or more Vehicles in Household |
| Mongolians | 1.0 /100 | #250 | Tragic 52.8% |
| Immigrants | Sudan | 1.0 /100 | #251 | Tragic 52.8% |
| Immigrants | Portugal | 1.0 /100 | #252 | Tragic 52.8% |
| Nigerians | 0.9 /100 | #253 | Tragic 52.8% |
| Immigrants | Malaysia | 0.8 /100 | #254 | Tragic 52.7% |
| Uruguayans | 0.7 /100 | #255 | Tragic 52.7% |
| Immigrants | Eritrea | 0.7 /100 | #256 | Tragic 52.6% |
| Immigrants | Hong Kong | 0.6 /100 | #257 | Tragic 52.6% |
| Central American Indians | 0.6 /100 | #258 | Tragic 52.5% |
| Alsatians | 0.6 /100 | #259 | Tragic 52.5% |
| Immigrants | Bahamas | 0.5 /100 | #260 | Tragic 52.5% |
| Immigrants | Australia | 0.5 /100 | #261 | Tragic 52.4% |
| Immigrants | Northern Africa | 0.4 /100 | #262 | Tragic 52.3% |
| Immigrants | Southern Europe | 0.4 /100 | #263 | Tragic 52.3% |
| Immigrants | Latvia | 0.4 /100 | #264 | Tragic 52.2% |
Demographics Similar to Arabs by 2 or more Vehicles in Household
In terms of 2 or more vehicles in household, the demographic groups most similar to Arabs are Apache (55.1%, a difference of 0.030%), Immigrants from Cameroon (55.1%, a difference of 0.060%), Immigrants from Micronesia (55.1%, a difference of 0.10%), Cree (55.1%, a difference of 0.10%), and Peruvian (55.0%, a difference of 0.10%).
| Demographics | Rating | Rank | 2 or more Vehicles in Household |
| Immigrants | Sweden | 45.3 /100 | #178 | Average 55.2% |
| Alaskan Athabascans | 42.9 /100 | #179 | Average 55.2% |
| Immigrants | Kenya | 40.4 /100 | #180 | Average 55.1% |
| Immigrants | Micronesia | 38.2 /100 | #181 | Fair 55.1% |
| Cree | 38.2 /100 | #182 | Fair 55.1% |
| Immigrants | Cameroon | 37.3 /100 | #183 | Fair 55.1% |
| Apache | 36.7 /100 | #184 | Fair 55.1% |
| Arabs | 35.9 /100 | #185 | Fair 55.0% |
| Peruvians | 33.7 /100 | #186 | Fair 55.0% |
| Immigrants | Uganda | 33.4 /100 | #187 | Fair 55.0% |
| Marshallese | 30.5 /100 | #188 | Fair 54.9% |
| Eastern Europeans | 27.5 /100 | #189 | Fair 54.8% |
| Russians | 26.3 /100 | #190 | Fair 54.8% |
| Immigrants | Immigrants | 25.0 /100 | #191 | Fair 54.7% |
| Immigrants | Romania | 23.8 /100 | #192 | Fair 54.7% |