Immigrants from Hong Kong vs Serbian Single Mother Households
COMPARE
Immigrants from Hong Kong
Serbian
Single Mother Households
Single Mother Households Comparison
Immigrants from Hong Kong
Serbians
4.8%
SINGLE MOTHER HOUSEHOLDS
100.0/ 100
METRIC RATING
5th/ 347
METRIC RANK
5.7%
SINGLE MOTHER HOUSEHOLDS
96.7/ 100
METRIC RATING
93rd/ 347
METRIC RANK
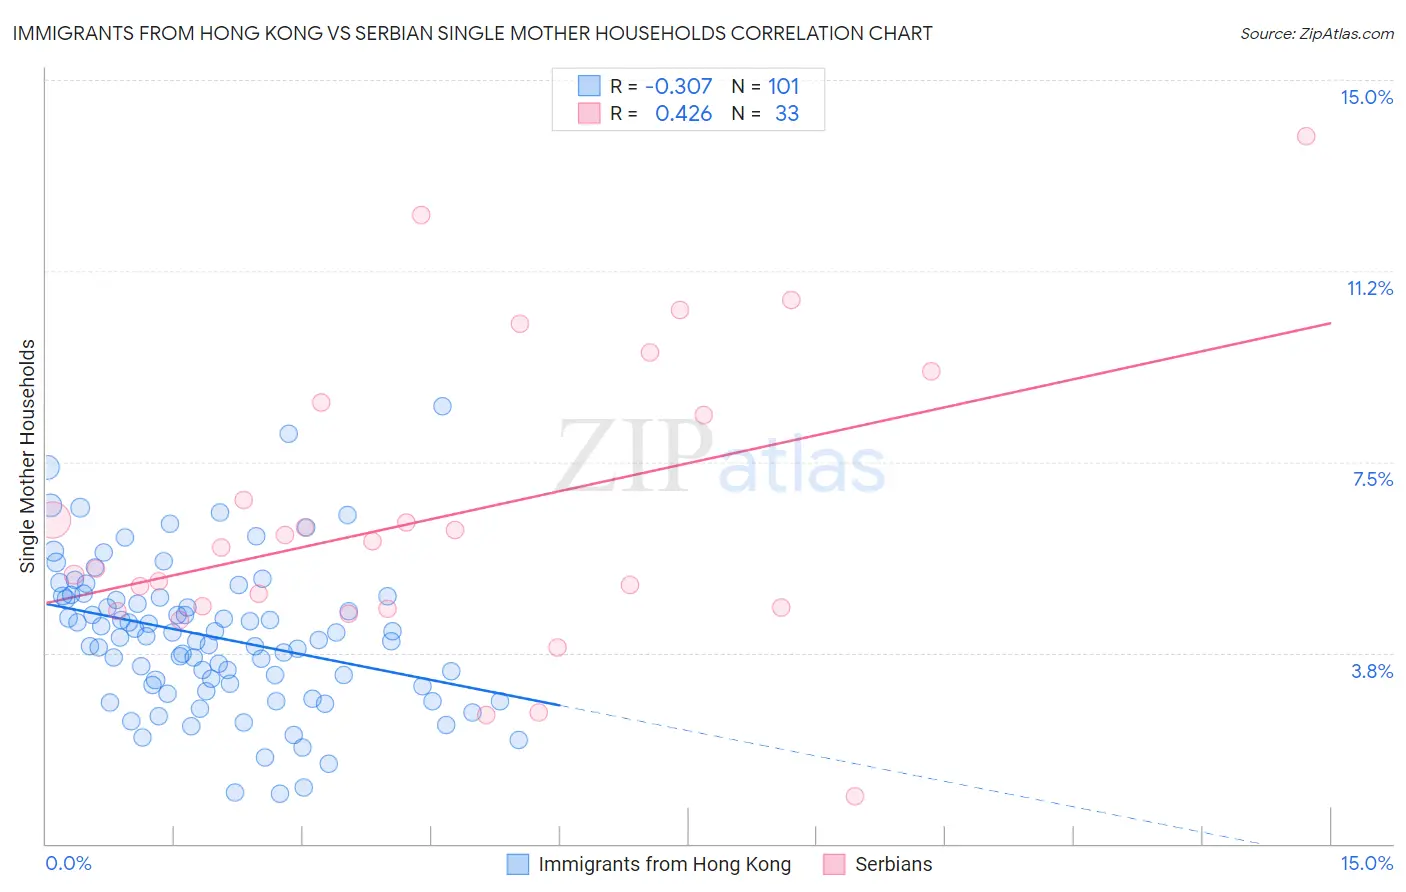
Immigrants from Hong Kong vs Serbian Single Mother Households Correlation Chart
The statistical analysis conducted on geographies consisting of 253,414,911 people shows a mild negative correlation between the proportion of Immigrants from Hong Kong and percentage of single mother households in the United States with a correlation coefficient (R) of -0.307 and weighted average of 4.8%. Similarly, the statistical analysis conducted on geographies consisting of 266,907,354 people shows a moderate positive correlation between the proportion of Serbians and percentage of single mother households in the United States with a correlation coefficient (R) of 0.426 and weighted average of 5.7%, a difference of 18.4%.
Single Mother Households Correlation Summary
| Measurement | Immigrants from Hong Kong | Serbian |
| Minimum | 0.98% | 0.92% |
| Maximum | 8.6% | 13.9% |
| Range | 7.6% | 13.0% |
| Mean | 4.1% | 6.4% |
| Median | 4.1% | 5.8% |
| Interquartile 25% (IQ1) | 3.1% | 4.6% |
| Interquartile 75% (IQ3) | 4.8% | 8.5% |
| Interquartile Range (IQR) | 1.7% | 3.9% |
| Standard Deviation (Sample) | 1.4% | 2.9% |
| Standard Deviation (Population) | 1.4% | 2.8% |
Similar Demographics by Single Mother Households
Demographics Similar to Immigrants from Hong Kong by Single Mother Households
In terms of single mother households, the demographic groups most similar to Immigrants from Hong Kong are Assyrian/Chaldean/Syriac (4.8%, a difference of 0.52%), Immigrants from Iran (4.8%, a difference of 0.60%), Immigrants from Singapore (5.0%, a difference of 2.6%), Iranian (5.0%, a difference of 2.8%), and Filipino (4.7%, a difference of 3.0%).
| Demographics | Rating | Rank | Single Mother Households |
| Immigrants | Taiwan | 100.0 /100 | #1 | Exceptional 4.7% |
| Filipinos | 100.0 /100 | #2 | Exceptional 4.7% |
| Immigrants | Iran | 100.0 /100 | #3 | Exceptional 4.8% |
| Assyrians/Chaldeans/Syriacs | 100.0 /100 | #4 | Exceptional 4.8% |
| Immigrants | Hong Kong | 100.0 /100 | #5 | Exceptional 4.8% |
| Immigrants | Singapore | 100.0 /100 | #6 | Exceptional 5.0% |
| Iranians | 100.0 /100 | #7 | Exceptional 5.0% |
| Immigrants | Ireland | 99.9 /100 | #8 | Exceptional 5.0% |
| Okinawans | 99.9 /100 | #9 | Exceptional 5.0% |
| Immigrants | Israel | 99.9 /100 | #10 | Exceptional 5.0% |
| Immigrants | China | 99.9 /100 | #11 | Exceptional 5.1% |
| Cypriots | 99.9 /100 | #12 | Exceptional 5.1% |
| Immigrants | India | 99.9 /100 | #13 | Exceptional 5.1% |
| Immigrants | Australia | 99.9 /100 | #14 | Exceptional 5.1% |
| Immigrants | Eastern Asia | 99.9 /100 | #15 | Exceptional 5.1% |
Demographics Similar to Serbians by Single Mother Households
In terms of single mother households, the demographic groups most similar to Serbians are Immigrants from Western Asia (5.7%, a difference of 0.010%), Basque (5.7%, a difference of 0.050%), Slovak (5.7%, a difference of 0.11%), European (5.7%, a difference of 0.24%), and Austrian (5.7%, a difference of 0.26%).
| Demographics | Rating | Rank | Single Mother Households |
| Finns | 97.6 /100 | #86 | Exceptional 5.7% |
| Immigrants | Turkey | 97.5 /100 | #87 | Exceptional 5.7% |
| Israelis | 97.4 /100 | #88 | Exceptional 5.7% |
| Ukrainians | 97.2 /100 | #89 | Exceptional 5.7% |
| Immigrants | Indonesia | 97.2 /100 | #90 | Exceptional 5.7% |
| Europeans | 97.0 /100 | #91 | Exceptional 5.7% |
| Immigrants | Western Asia | 96.7 /100 | #92 | Exceptional 5.7% |
| Serbians | 96.7 /100 | #93 | Exceptional 5.7% |
| Basques | 96.7 /100 | #94 | Exceptional 5.7% |
| Slovaks | 96.6 /100 | #95 | Exceptional 5.7% |
| Austrians | 96.4 /100 | #96 | Exceptional 5.7% |
| Tlingit-Haida | 96.4 /100 | #97 | Exceptional 5.7% |
| Immigrants | South Africa | 96.3 /100 | #98 | Exceptional 5.7% |
| Immigrants | Poland | 96.3 /100 | #99 | Exceptional 5.8% |
| Scandinavians | 96.2 /100 | #100 | Exceptional 5.8% |