Immigrants from Honduras vs Navajo 4 or more Vehicles in Household
COMPARE
Immigrants from Honduras
Navajo
4 or more Vehicles in Household
4 or more Vehicles in Household Comparison
Immigrants from Honduras
Navajo
6.1%
4 OR MORE VEHICLES IN HOUSEHOLD
15.4/ 100
METRIC RATING
209th/ 347
METRIC RANK
8.2%
4 OR MORE VEHICLES IN HOUSEHOLD
100.0/ 100
METRIC RATING
30th/ 347
METRIC RANK
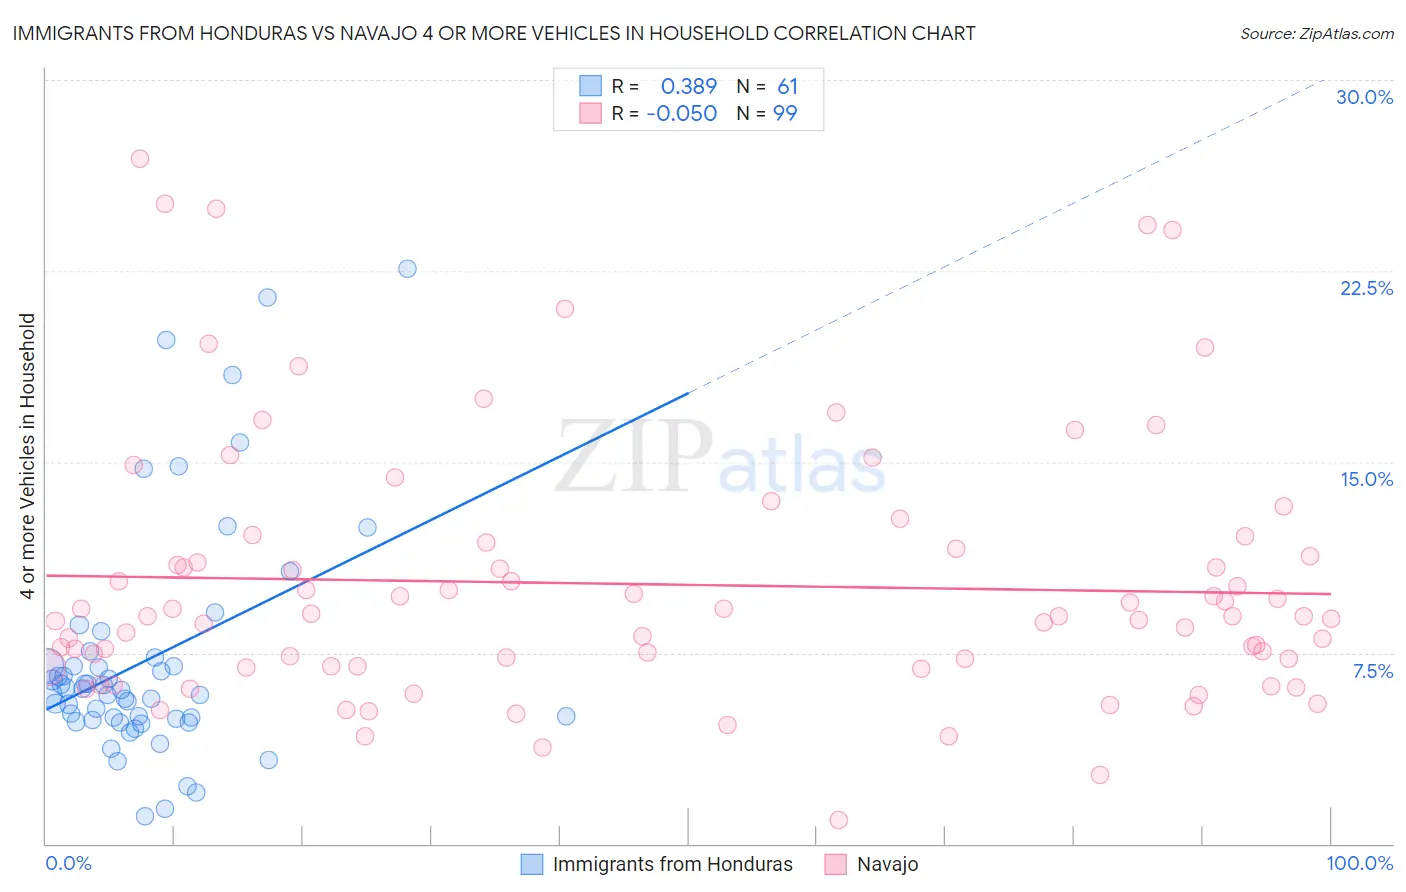
Immigrants from Honduras vs Navajo 4 or more Vehicles in Household Correlation Chart
The statistical analysis conducted on geographies consisting of 321,252,543 people shows a mild positive correlation between the proportion of Immigrants from Honduras and percentage of households with 4 or more vehicles available in the United States with a correlation coefficient (R) of 0.389 and weighted average of 6.1%. Similarly, the statistical analysis conducted on geographies consisting of 224,231,101 people shows a slight negative correlation between the proportion of Navajo and percentage of households with 4 or more vehicles available in the United States with a correlation coefficient (R) of -0.050 and weighted average of 8.2%, a difference of 35.8%.
4 or more Vehicles in Household Correlation Summary
| Measurement | Immigrants from Honduras | Navajo |
| Minimum | 1.1% | 0.93% |
| Maximum | 22.6% | 26.9% |
| Range | 21.5% | 26.0% |
| Mean | 7.3% | 10.2% |
| Median | 6.1% | 8.9% |
| Interquartile 25% (IQ1) | 4.9% | 7.0% |
| Interquartile 75% (IQ3) | 7.2% | 11.6% |
| Interquartile Range (IQR) | 2.3% | 4.6% |
| Standard Deviation (Sample) | 4.6% | 5.1% |
| Standard Deviation (Population) | 4.6% | 5.1% |
Similar Demographics by 4 or more Vehicles in Household
Demographics Similar to Immigrants from Honduras by 4 or more Vehicles in Household
In terms of 4 or more vehicles in household, the demographic groups most similar to Immigrants from Honduras are Immigrants from Nigeria (6.1%, a difference of 0.030%), Immigrants from Zimbabwe (6.0%, a difference of 0.050%), Panamanian (6.0%, a difference of 0.13%), Immigrants from Egypt (6.0%, a difference of 0.15%), and Arab (6.0%, a difference of 0.21%).
| Demographics | Rating | Rank | 4 or more Vehicles in Household |
| Immigrants | South Central Asia | 21.3 /100 | #202 | Fair 6.1% |
| Immigrants | Sierra Leone | 20.5 /100 | #203 | Fair 6.1% |
| Immigrants | Belize | 19.8 /100 | #204 | Poor 6.1% |
| Hondurans | 19.3 /100 | #205 | Poor 6.1% |
| Kenyans | 18.5 /100 | #206 | Poor 6.1% |
| Immigrants | Chile | 16.9 /100 | #207 | Poor 6.1% |
| Immigrants | Nigeria | 15.6 /100 | #208 | Poor 6.1% |
| Immigrants | Honduras | 15.4 /100 | #209 | Poor 6.1% |
| Immigrants | Zimbabwe | 15.1 /100 | #210 | Poor 6.0% |
| Panamanians | 14.8 /100 | #211 | Poor 6.0% |
| Immigrants | Egypt | 14.7 /100 | #212 | Poor 6.0% |
| Arabs | 14.4 /100 | #213 | Poor 6.0% |
| Immigrants | Austria | 14.3 /100 | #214 | Poor 6.0% |
| Immigrants | China | 13.8 /100 | #215 | Poor 6.0% |
| Immigrants | Romania | 13.8 /100 | #216 | Poor 6.0% |
Demographics Similar to Navajo by 4 or more Vehicles in Household
In terms of 4 or more vehicles in household, the demographic groups most similar to Navajo are Immigrants from South Eastern Asia (8.2%, a difference of 0.030%), Native/Alaskan (8.2%, a difference of 0.40%), Cheyenne (8.3%, a difference of 0.69%), Marshallese (8.1%, a difference of 0.94%), and Yaqui (8.1%, a difference of 1.2%).
| Demographics | Rating | Rank | 4 or more Vehicles in Household |
| Immigrants | Philippines | 100.0 /100 | #23 | Exceptional 8.5% |
| Immigrants | Central America | 100.0 /100 | #24 | Exceptional 8.5% |
| Basques | 100.0 /100 | #25 | Exceptional 8.4% |
| Mexican American Indians | 100.0 /100 | #26 | Exceptional 8.4% |
| Sri Lankans | 100.0 /100 | #27 | Exceptional 8.4% |
| Cheyenne | 100.0 /100 | #28 | Exceptional 8.3% |
| Immigrants | South Eastern Asia | 100.0 /100 | #29 | Exceptional 8.2% |
| Navajo | 100.0 /100 | #30 | Exceptional 8.2% |
| Natives/Alaskans | 100.0 /100 | #31 | Exceptional 8.2% |
| Marshallese | 100.0 /100 | #32 | Exceptional 8.1% |
| Yaqui | 100.0 /100 | #33 | Exceptional 8.1% |
| Alaskan Athabascans | 100.0 /100 | #34 | Exceptional 8.1% |
| Guamanians/Chamorros | 100.0 /100 | #35 | Exceptional 8.1% |
| Norwegians | 100.0 /100 | #36 | Exceptional 8.0% |
| Scandinavians | 100.0 /100 | #37 | Exceptional 8.0% |