Immigrants from Honduras vs Seminole 4 or more Vehicles in Household
COMPARE
Immigrants from Honduras
Seminole
4 or more Vehicles in Household
4 or more Vehicles in Household Comparison
Immigrants from Honduras
Seminole
6.1%
4 OR MORE VEHICLES IN HOUSEHOLD
15.4/ 100
METRIC RATING
209th/ 347
METRIC RANK
7.0%
4 OR MORE VEHICLES IN HOUSEHOLD
98.8/ 100
METRIC RATING
99th/ 347
METRIC RANK
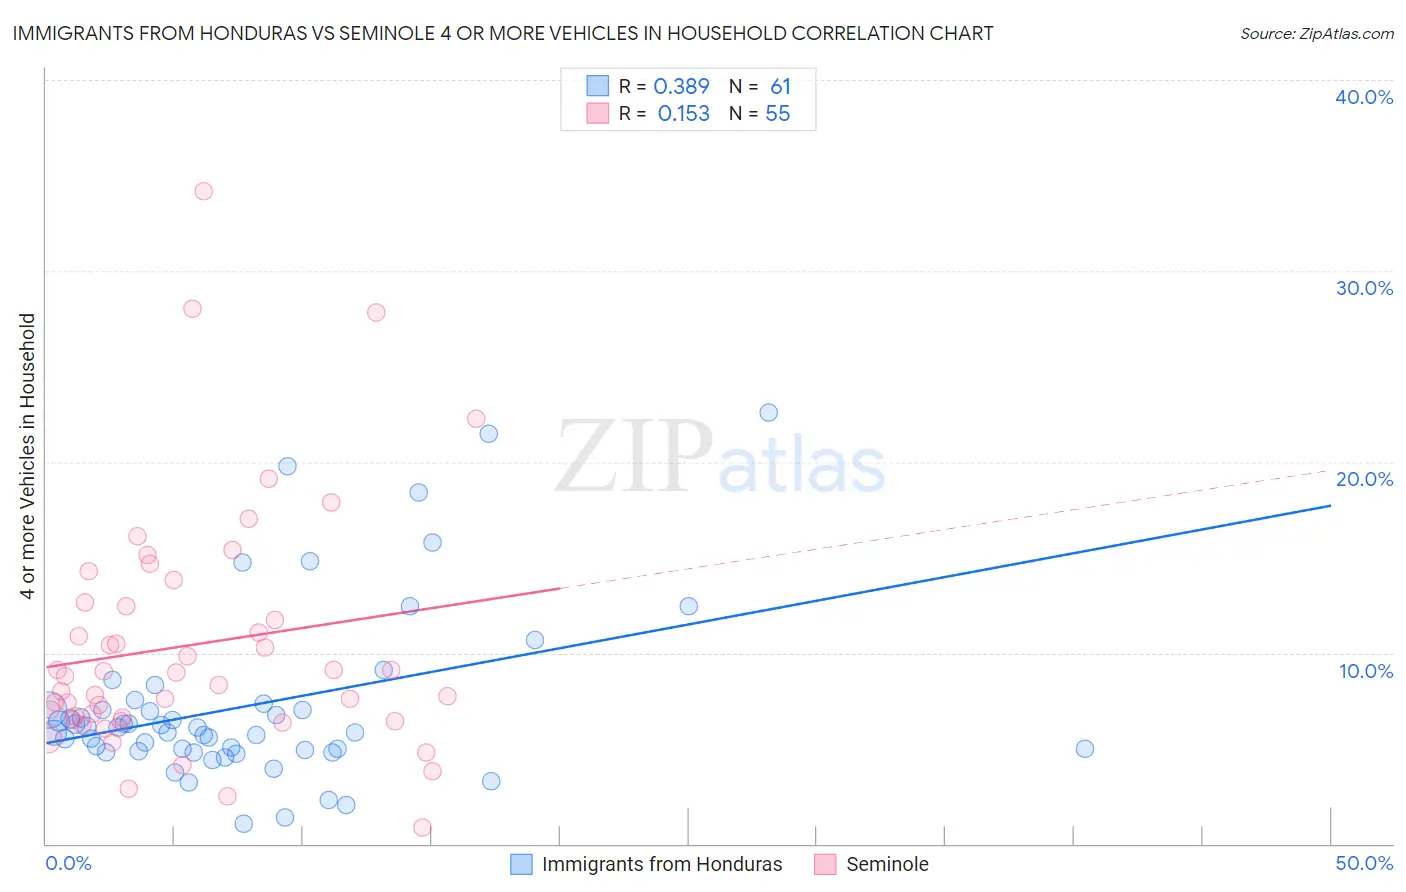
Immigrants from Honduras vs Seminole 4 or more Vehicles in Household Correlation Chart
The statistical analysis conducted on geographies consisting of 321,252,543 people shows a mild positive correlation between the proportion of Immigrants from Honduras and percentage of households with 4 or more vehicles available in the United States with a correlation coefficient (R) of 0.389 and weighted average of 6.1%. Similarly, the statistical analysis conducted on geographies consisting of 118,205,543 people shows a poor positive correlation between the proportion of Seminole and percentage of households with 4 or more vehicles available in the United States with a correlation coefficient (R) of 0.153 and weighted average of 7.0%, a difference of 16.1%.
4 or more Vehicles in Household Correlation Summary
| Measurement | Immigrants from Honduras | Seminole |
| Minimum | 1.1% | 0.87% |
| Maximum | 22.6% | 34.2% |
| Range | 21.5% | 33.3% |
| Mean | 7.3% | 10.4% |
| Median | 6.1% | 8.8% |
| Interquartile 25% (IQ1) | 4.9% | 6.4% |
| Interquartile 75% (IQ3) | 7.2% | 12.6% |
| Interquartile Range (IQR) | 2.3% | 6.2% |
| Standard Deviation (Sample) | 4.6% | 6.4% |
| Standard Deviation (Population) | 4.6% | 6.4% |
Similar Demographics by 4 or more Vehicles in Household
Demographics Similar to Immigrants from Honduras by 4 or more Vehicles in Household
In terms of 4 or more vehicles in household, the demographic groups most similar to Immigrants from Honduras are Immigrants from Nigeria (6.1%, a difference of 0.030%), Immigrants from Zimbabwe (6.0%, a difference of 0.050%), Panamanian (6.0%, a difference of 0.13%), Immigrants from Egypt (6.0%, a difference of 0.15%), and Arab (6.0%, a difference of 0.21%).
| Demographics | Rating | Rank | 4 or more Vehicles in Household |
| Immigrants | South Central Asia | 21.3 /100 | #202 | Fair 6.1% |
| Immigrants | Sierra Leone | 20.5 /100 | #203 | Fair 6.1% |
| Immigrants | Belize | 19.8 /100 | #204 | Poor 6.1% |
| Hondurans | 19.3 /100 | #205 | Poor 6.1% |
| Kenyans | 18.5 /100 | #206 | Poor 6.1% |
| Immigrants | Chile | 16.9 /100 | #207 | Poor 6.1% |
| Immigrants | Nigeria | 15.6 /100 | #208 | Poor 6.1% |
| Immigrants | Honduras | 15.4 /100 | #209 | Poor 6.1% |
| Immigrants | Zimbabwe | 15.1 /100 | #210 | Poor 6.0% |
| Panamanians | 14.8 /100 | #211 | Poor 6.0% |
| Immigrants | Egypt | 14.7 /100 | #212 | Poor 6.0% |
| Arabs | 14.4 /100 | #213 | Poor 6.0% |
| Immigrants | Austria | 14.3 /100 | #214 | Poor 6.0% |
| Immigrants | China | 13.8 /100 | #215 | Poor 6.0% |
| Immigrants | Romania | 13.8 /100 | #216 | Poor 6.0% |
Demographics Similar to Seminole by 4 or more Vehicles in Household
In terms of 4 or more vehicles in household, the demographic groups most similar to Seminole are Taiwanese (7.0%, a difference of 0.080%), Pakistani (7.0%, a difference of 0.15%), Asian (7.0%, a difference of 0.21%), Blackfeet (7.0%, a difference of 0.22%), and Irish (7.1%, a difference of 0.44%).
| Demographics | Rating | Rank | 4 or more Vehicles in Household |
| Immigrants | Latin America | 99.4 /100 | #92 | Exceptional 7.1% |
| Immigrants | Afghanistan | 99.3 /100 | #93 | Exceptional 7.1% |
| Dutch West Indians | 99.3 /100 | #94 | Exceptional 7.1% |
| Czechoslovakians | 99.3 /100 | #95 | Exceptional 7.1% |
| Central Americans | 99.3 /100 | #96 | Exceptional 7.1% |
| Celtics | 99.1 /100 | #97 | Exceptional 7.1% |
| Irish | 99.0 /100 | #98 | Exceptional 7.1% |
| Seminole | 98.8 /100 | #99 | Exceptional 7.0% |
| Taiwanese | 98.7 /100 | #100 | Exceptional 7.0% |
| Pakistanis | 98.7 /100 | #101 | Exceptional 7.0% |
| Asians | 98.6 /100 | #102 | Exceptional 7.0% |
| Blackfeet | 98.6 /100 | #103 | Exceptional 7.0% |
| Hmong | 98.3 /100 | #104 | Exceptional 7.0% |
| German Russians | 98.3 /100 | #105 | Exceptional 7.0% |
| Guatemalans | 98.1 /100 | #106 | Exceptional 7.0% |