Somali vs Navajo 4 or more Vehicles in Household
COMPARE
Somali
Navajo
4 or more Vehicles in Household
4 or more Vehicles in Household Comparison
Somalis
Navajo
5.0%
4 OR MORE VEHICLES IN HOUSEHOLD
0.0/ 100
METRIC RATING
305th/ 347
METRIC RANK
8.2%
4 OR MORE VEHICLES IN HOUSEHOLD
100.0/ 100
METRIC RATING
30th/ 347
METRIC RANK
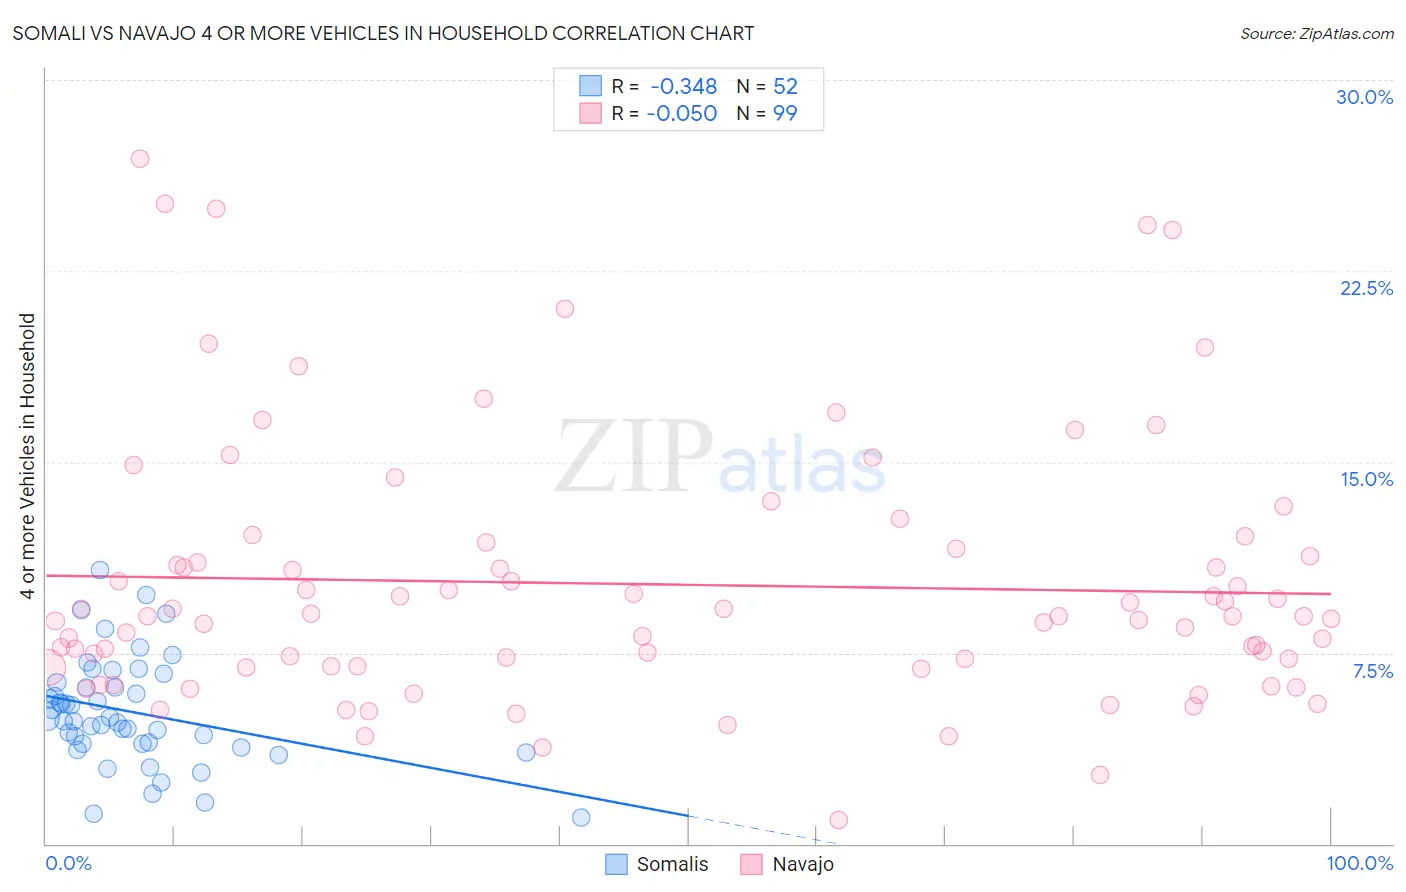
Somali vs Navajo 4 or more Vehicles in Household Correlation Chart
The statistical analysis conducted on geographies consisting of 99,181,169 people shows a mild negative correlation between the proportion of Somalis and percentage of households with 4 or more vehicles available in the United States with a correlation coefficient (R) of -0.348 and weighted average of 5.0%. Similarly, the statistical analysis conducted on geographies consisting of 224,231,101 people shows a slight negative correlation between the proportion of Navajo and percentage of households with 4 or more vehicles available in the United States with a correlation coefficient (R) of -0.050 and weighted average of 8.2%, a difference of 63.6%.
4 or more Vehicles in Household Correlation Summary
| Measurement | Somali | Navajo |
| Minimum | 1.0% | 0.93% |
| Maximum | 10.8% | 26.9% |
| Range | 9.7% | 26.0% |
| Mean | 5.2% | 10.2% |
| Median | 4.9% | 8.9% |
| Interquartile 25% (IQ1) | 3.9% | 7.0% |
| Interquartile 75% (IQ3) | 6.2% | 11.6% |
| Interquartile Range (IQR) | 2.3% | 4.6% |
| Standard Deviation (Sample) | 2.1% | 5.1% |
| Standard Deviation (Population) | 2.1% | 5.1% |
Similar Demographics by 4 or more Vehicles in Household
Demographics Similar to Somalis by 4 or more Vehicles in Household
In terms of 4 or more vehicles in household, the demographic groups most similar to Somalis are Cypriot (5.0%, a difference of 0.0%), Immigrants from Serbia (5.0%, a difference of 0.090%), Immigrants from Greece (5.1%, a difference of 0.56%), Bahamian (5.1%, a difference of 1.0%), and Menominee (5.0%, a difference of 1.0%).
| Demographics | Rating | Rank | 4 or more Vehicles in Household |
| Immigrants | South America | 0.1 /100 | #298 | Tragic 5.2% |
| Immigrants | Ghana | 0.1 /100 | #299 | Tragic 5.2% |
| Immigrants | Morocco | 0.0 /100 | #300 | Tragic 5.1% |
| Immigrants | Zaire | 0.0 /100 | #301 | Tragic 5.1% |
| Bahamians | 0.0 /100 | #302 | Tragic 5.1% |
| Immigrants | Greece | 0.0 /100 | #303 | Tragic 5.1% |
| Cypriots | 0.0 /100 | #304 | Tragic 5.0% |
| Somalis | 0.0 /100 | #305 | Tragic 5.0% |
| Immigrants | Serbia | 0.0 /100 | #306 | Tragic 5.0% |
| Menominee | 0.0 /100 | #307 | Tragic 5.0% |
| Paraguayans | 0.0 /100 | #308 | Tragic 4.9% |
| Immigrants | Somalia | 0.0 /100 | #309 | Tragic 4.9% |
| Moroccans | 0.0 /100 | #310 | Tragic 4.9% |
| Houma | 0.0 /100 | #311 | Tragic 4.9% |
| Albanians | 0.0 /100 | #312 | Tragic 4.8% |
Demographics Similar to Navajo by 4 or more Vehicles in Household
In terms of 4 or more vehicles in household, the demographic groups most similar to Navajo are Immigrants from South Eastern Asia (8.2%, a difference of 0.030%), Native/Alaskan (8.2%, a difference of 0.40%), Cheyenne (8.3%, a difference of 0.69%), Marshallese (8.1%, a difference of 0.94%), and Yaqui (8.1%, a difference of 1.2%).
| Demographics | Rating | Rank | 4 or more Vehicles in Household |
| Immigrants | Philippines | 100.0 /100 | #23 | Exceptional 8.5% |
| Immigrants | Central America | 100.0 /100 | #24 | Exceptional 8.5% |
| Basques | 100.0 /100 | #25 | Exceptional 8.4% |
| Mexican American Indians | 100.0 /100 | #26 | Exceptional 8.4% |
| Sri Lankans | 100.0 /100 | #27 | Exceptional 8.4% |
| Cheyenne | 100.0 /100 | #28 | Exceptional 8.3% |
| Immigrants | South Eastern Asia | 100.0 /100 | #29 | Exceptional 8.2% |
| Navajo | 100.0 /100 | #30 | Exceptional 8.2% |
| Natives/Alaskans | 100.0 /100 | #31 | Exceptional 8.2% |
| Marshallese | 100.0 /100 | #32 | Exceptional 8.1% |
| Yaqui | 100.0 /100 | #33 | Exceptional 8.1% |
| Alaskan Athabascans | 100.0 /100 | #34 | Exceptional 8.1% |
| Guamanians/Chamorros | 100.0 /100 | #35 | Exceptional 8.1% |
| Norwegians | 100.0 /100 | #36 | Exceptional 8.0% |
| Scandinavians | 100.0 /100 | #37 | Exceptional 8.0% |