Immigrants from Honduras vs Sudanese 3 or more Vehicles in Household
COMPARE
Immigrants from Honduras
Sudanese
3 or more Vehicles in Household
3 or more Vehicles in Household Comparison
Immigrants from Honduras
Sudanese
18.2%
3 OR MORE VEHICLES IN HOUSEHOLD
3.1/ 100
METRIC RATING
238th/ 347
METRIC RANK
17.8%
3 OR MORE VEHICLES IN HOUSEHOLD
1.1/ 100
METRIC RATING
258th/ 347
METRIC RANK
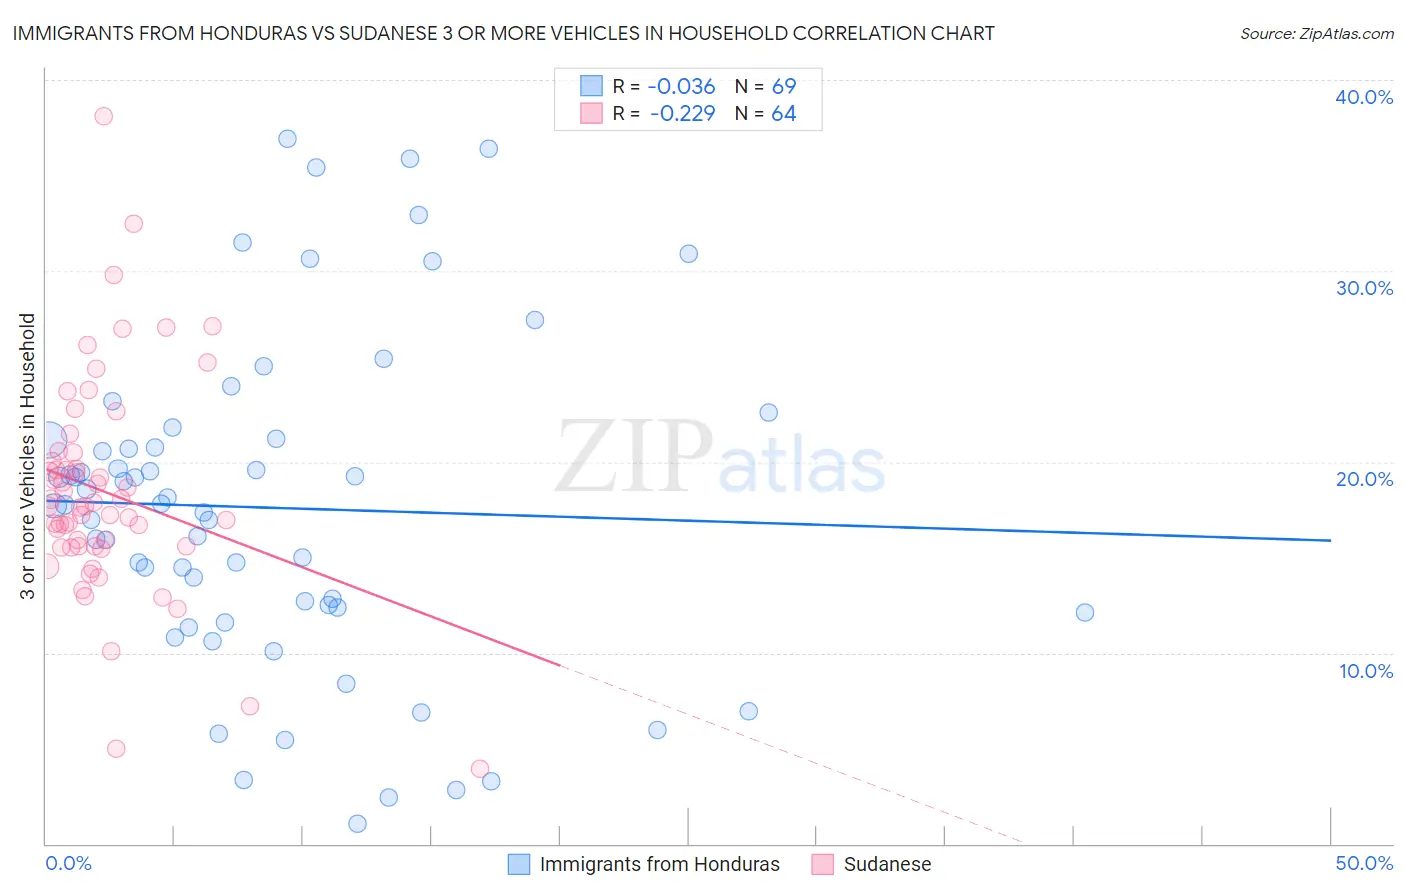
Immigrants from Honduras vs Sudanese 3 or more Vehicles in Household Correlation Chart
The statistical analysis conducted on geographies consisting of 322,444,199 people shows no correlation between the proportion of Immigrants from Honduras and percentage of households with 3 or more vehicles available in the United States with a correlation coefficient (R) of -0.036 and weighted average of 18.2%. Similarly, the statistical analysis conducted on geographies consisting of 110,082,640 people shows a weak negative correlation between the proportion of Sudanese and percentage of households with 3 or more vehicles available in the United States with a correlation coefficient (R) of -0.229 and weighted average of 17.8%, a difference of 2.2%.
3 or more Vehicles in Household Correlation Summary
| Measurement | Immigrants from Honduras | Sudanese |
| Minimum | 1.0% | 3.9% |
| Maximum | 36.9% | 38.1% |
| Range | 35.9% | 34.2% |
| Mean | 17.6% | 18.4% |
| Median | 17.7% | 17.7% |
| Interquartile 25% (IQ1) | 12.3% | 15.6% |
| Interquartile 75% (IQ3) | 21.2% | 20.3% |
| Interquartile Range (IQR) | 8.9% | 4.7% |
| Standard Deviation (Sample) | 8.6% | 5.7% |
| Standard Deviation (Population) | 8.5% | 5.7% |
Demographics Similar to Immigrants from Honduras and Sudanese by 3 or more Vehicles in Household
In terms of 3 or more vehicles in household, the demographic groups most similar to Immigrants from Honduras are Immigrants from Middle Africa (18.2%, a difference of 0.010%), Immigrants from China (18.2%, a difference of 0.13%), African (18.2%, a difference of 0.33%), Hopi (18.2%, a difference of 0.44%), and Immigrants from Europe (18.1%, a difference of 0.56%). Similarly, the demographic groups most similar to Sudanese are Immigrants from Eritrea (17.8%, a difference of 0.0%), Subsaharan African (17.9%, a difference of 0.050%), Immigrants from Turkey (17.9%, a difference of 0.20%), Immigrants from Ethiopia (17.9%, a difference of 0.23%), and Ethiopian (17.9%, a difference of 0.23%).
| Demographics | Rating | Rank | 3 or more Vehicles in Household |
| Immigrants | Honduras | 3.1 /100 | #238 | Tragic 18.2% |
| Immigrants | Middle Africa | 3.1 /100 | #239 | Tragic 18.2% |
| Immigrants | China | 2.9 /100 | #240 | Tragic 18.2% |
| Africans | 2.7 /100 | #241 | Tragic 18.2% |
| Hopi | 2.5 /100 | #242 | Tragic 18.2% |
| Immigrants | Europe | 2.4 /100 | #243 | Tragic 18.1% |
| Mongolians | 2.3 /100 | #244 | Tragic 18.1% |
| Immigrants | Belize | 2.1 /100 | #245 | Tragic 18.1% |
| Immigrants | Australia | 2.0 /100 | #246 | Tragic 18.1% |
| Carpatho Rusyns | 1.9 /100 | #247 | Tragic 18.0% |
| Immigrants | Eastern Africa | 1.8 /100 | #248 | Tragic 18.0% |
| Immigrants | Saudi Arabia | 1.7 /100 | #249 | Tragic 18.0% |
| Venezuelans | 1.7 /100 | #250 | Tragic 18.0% |
| Alsatians | 1.5 /100 | #251 | Tragic 18.0% |
| Immigrants | Southern Europe | 1.4 /100 | #252 | Tragic 17.9% |
| Immigrants | Ethiopia | 1.3 /100 | #253 | Tragic 17.9% |
| Ethiopians | 1.2 /100 | #254 | Tragic 17.9% |
| Immigrants | Turkey | 1.2 /100 | #255 | Tragic 17.9% |
| Sub-Saharan Africans | 1.1 /100 | #256 | Tragic 17.9% |
| Immigrants | Eritrea | 1.1 /100 | #257 | Tragic 17.8% |
| Sudanese | 1.1 /100 | #258 | Tragic 17.8% |