Immigrants from Honduras vs Immigrants from Bulgaria In Labor Force | Age 20-24
COMPARE
Immigrants from Honduras
Immigrants from Bulgaria
In Labor Force | Age 20-24
In Labor Force | Age 20-24 Comparison
Immigrants from Honduras
Immigrants from Bulgaria
74.9%
IN LABOR FORCE | AGE 20-24
33.5/ 100
METRIC RATING
187th/ 347
METRIC RANK
75.8%
IN LABOR FORCE | AGE 20-24
94.1/ 100
METRIC RATING
123rd/ 347
METRIC RANK
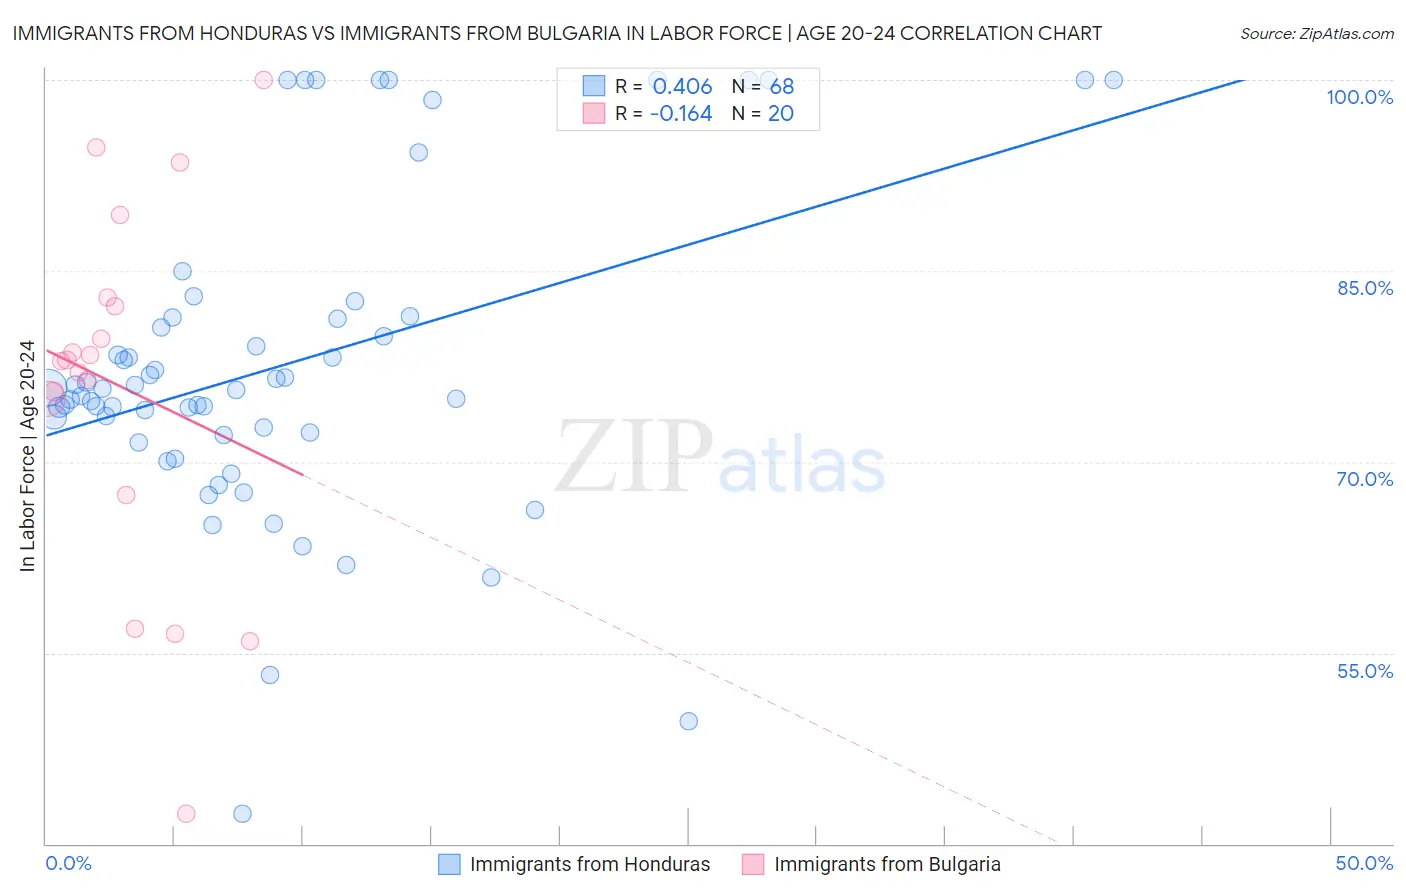
Immigrants from Honduras vs Immigrants from Bulgaria In Labor Force | Age 20-24 Correlation Chart
The statistical analysis conducted on geographies consisting of 322,549,520 people shows a moderate positive correlation between the proportion of Immigrants from Honduras and labor force participation rate among population between the ages 20 and 24 in the United States with a correlation coefficient (R) of 0.406 and weighted average of 74.9%. Similarly, the statistical analysis conducted on geographies consisting of 172,510,065 people shows a poor negative correlation between the proportion of Immigrants from Bulgaria and labor force participation rate among population between the ages 20 and 24 in the United States with a correlation coefficient (R) of -0.164 and weighted average of 75.8%, a difference of 1.3%.
In Labor Force | Age 20-24 Correlation Summary
| Measurement | Immigrants from Honduras | Immigrants from Bulgaria |
| Minimum | 42.4% | 42.4% |
| Maximum | 100.0% | 100.0% |
| Range | 57.6% | 57.6% |
| Mean | 77.5% | 75.9% |
| Median | 75.7% | 77.9% |
| Interquartile 25% (IQ1) | 72.2% | 71.2% |
| Interquartile 75% (IQ3) | 81.3% | 82.6% |
| Interquartile Range (IQR) | 9.1% | 11.4% |
| Standard Deviation (Sample) | 12.5% | 14.3% |
| Standard Deviation (Population) | 12.4% | 13.9% |
Similar Demographics by In Labor Force | Age 20-24
Demographics Similar to Immigrants from Honduras by In Labor Force | Age 20-24
In terms of in labor force | age 20-24, the demographic groups most similar to Immigrants from Honduras are Immigrants from Eastern Europe (74.9%, a difference of 0.010%), Honduran (74.8%, a difference of 0.010%), Immigrants from Northern Europe (74.8%, a difference of 0.010%), Immigrants from Hungary (74.9%, a difference of 0.020%), and Sri Lankan (74.9%, a difference of 0.020%).
| Demographics | Rating | Rank | In Labor Force | Age 20-24 |
| Immigrants | Czechoslovakia | 44.0 /100 | #180 | Average 75.0% |
| Africans | 42.5 /100 | #181 | Average 75.0% |
| Immigrants | South Africa | 36.9 /100 | #182 | Fair 74.9% |
| Immigrants | Costa Rica | 36.7 /100 | #183 | Fair 74.9% |
| Immigrants | Hungary | 35.0 /100 | #184 | Fair 74.9% |
| Sri Lankans | 34.9 /100 | #185 | Fair 74.9% |
| Immigrants | Eastern Europe | 33.8 /100 | #186 | Fair 74.9% |
| Immigrants | Honduras | 33.5 /100 | #187 | Fair 74.9% |
| Hondurans | 32.7 /100 | #188 | Fair 74.8% |
| Immigrants | Northern Europe | 32.6 /100 | #189 | Fair 74.8% |
| Russians | 32.2 /100 | #190 | Fair 74.8% |
| Senegalese | 28.1 /100 | #191 | Fair 74.8% |
| Immigrants | Europe | 27.5 /100 | #192 | Fair 74.8% |
| Alsatians | 27.1 /100 | #193 | Fair 74.8% |
| Immigrants | Denmark | 25.8 /100 | #194 | Fair 74.8% |
Demographics Similar to Immigrants from Bulgaria by In Labor Force | Age 20-24
In terms of in labor force | age 20-24, the demographic groups most similar to Immigrants from Bulgaria are Pakistani (75.8%, a difference of 0.0%), Immigrants from Serbia (75.8%, a difference of 0.010%), Immigrants from Sierra Leone (75.8%, a difference of 0.020%), Immigrants from Scotland (75.8%, a difference of 0.030%), and Immigrants from Africa (75.8%, a difference of 0.040%).
| Demographics | Rating | Rank | In Labor Force | Age 20-24 |
| Immigrants | North America | 95.0 /100 | #116 | Exceptional 75.9% |
| Assyrians/Chaldeans/Syriacs | 94.9 /100 | #117 | Exceptional 75.9% |
| Spanish Americans | 94.8 /100 | #118 | Exceptional 75.8% |
| Immigrants | Portugal | 94.8 /100 | #119 | Exceptional 75.8% |
| Immigrants | Africa | 94.6 /100 | #120 | Exceptional 75.8% |
| Immigrants | Serbia | 94.3 /100 | #121 | Exceptional 75.8% |
| Pakistanis | 94.1 /100 | #122 | Exceptional 75.8% |
| Immigrants | Bulgaria | 94.1 /100 | #123 | Exceptional 75.8% |
| Immigrants | Sierra Leone | 93.8 /100 | #124 | Exceptional 75.8% |
| Immigrants | Scotland | 93.7 /100 | #125 | Exceptional 75.8% |
| Brazilians | 93.0 /100 | #126 | Exceptional 75.8% |
| Sub-Saharan Africans | 90.9 /100 | #127 | Exceptional 75.7% |
| Immigrants | Afghanistan | 89.4 /100 | #128 | Excellent 75.6% |
| Iroquois | 89.1 /100 | #129 | Excellent 75.6% |
| Immigrants | Austria | 88.8 /100 | #130 | Excellent 75.6% |