Immigrants from Ghana vs Immigrants from Trinidad and Tobago 10th Grade
COMPARE
Immigrants from Ghana
Immigrants from Trinidad and Tobago
10th Grade
10th Grade Comparison
Immigrants from Ghana
Immigrants from Trinidad and Tobago
92.5%
10TH GRADE
0.3/ 100
METRIC RATING
268th/ 347
METRIC RANK
92.3%
10TH GRADE
0.1/ 100
METRIC RATING
276th/ 347
METRIC RANK
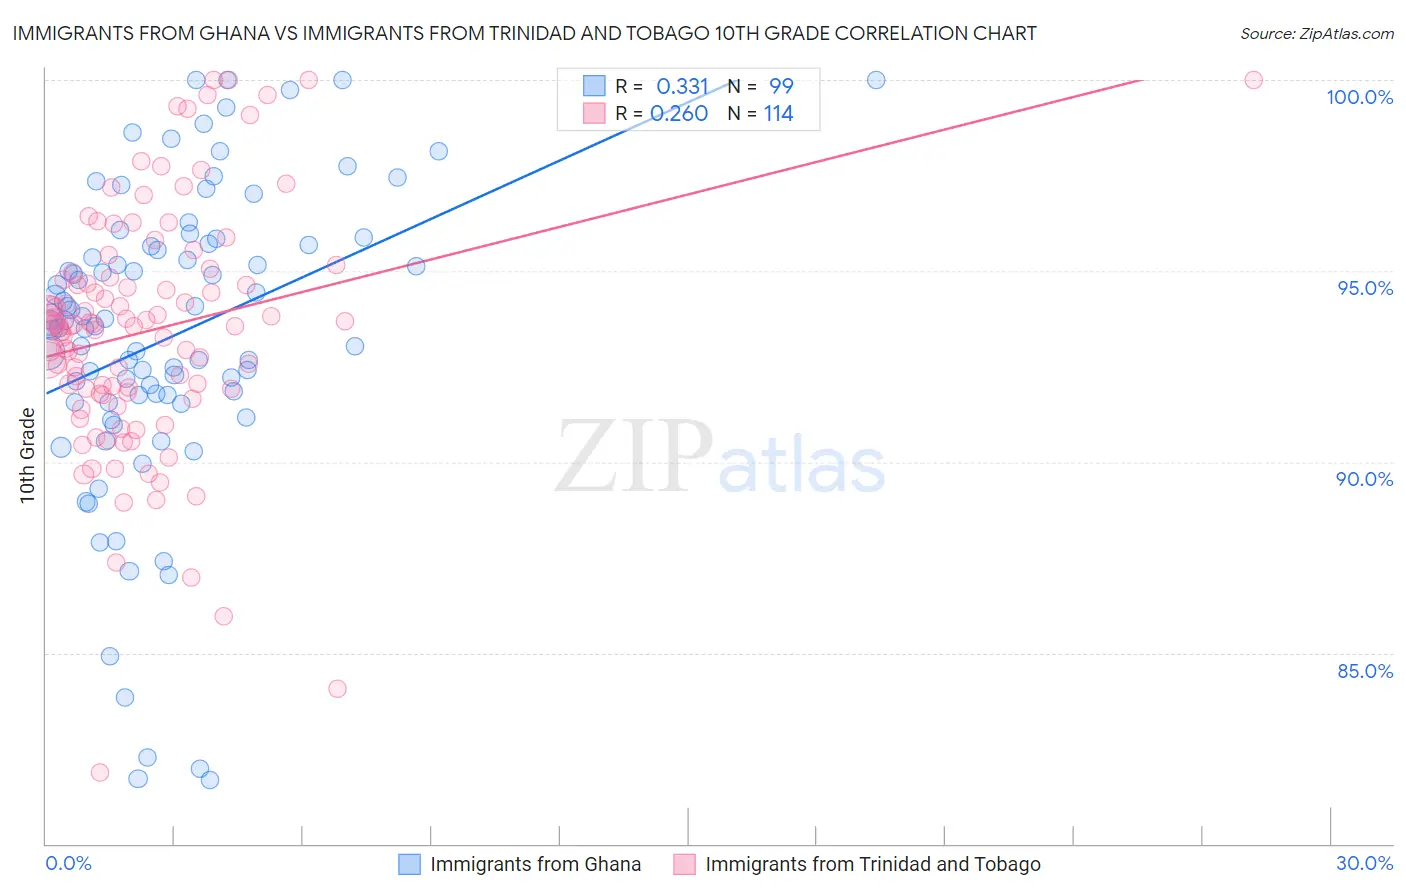
Immigrants from Ghana vs Immigrants from Trinidad and Tobago 10th Grade Correlation Chart
The statistical analysis conducted on geographies consisting of 199,952,023 people shows a mild positive correlation between the proportion of Immigrants from Ghana and percentage of population with at least 10th grade education in the United States with a correlation coefficient (R) of 0.331 and weighted average of 92.5%. Similarly, the statistical analysis conducted on geographies consisting of 223,526,834 people shows a weak positive correlation between the proportion of Immigrants from Trinidad and Tobago and percentage of population with at least 10th grade education in the United States with a correlation coefficient (R) of 0.260 and weighted average of 92.3%, a difference of 0.24%.
10th Grade Correlation Summary
| Measurement | Immigrants from Ghana | Immigrants from Trinidad and Tobago |
| Minimum | 81.7% | 81.9% |
| Maximum | 100.0% | 100.0% |
| Range | 18.3% | 18.1% |
| Mean | 93.2% | 93.4% |
| Median | 93.6% | 93.6% |
| Interquartile 25% (IQ1) | 91.6% | 91.8% |
| Interquartile 75% (IQ3) | 95.7% | 94.8% |
| Interquartile Range (IQR) | 4.1% | 3.0% |
| Standard Deviation (Sample) | 4.0% | 3.2% |
| Standard Deviation (Population) | 4.0% | 3.2% |
Demographics Similar to Immigrants from Ghana and Immigrants from Trinidad and Tobago by 10th Grade
In terms of 10th grade, the demographic groups most similar to Immigrants from Ghana are Taiwanese (92.5%, a difference of 0.0%), Dutch West Indian (92.6%, a difference of 0.010%), Immigrants from Philippines (92.6%, a difference of 0.010%), Immigrants from Colombia (92.5%, a difference of 0.020%), and Immigrants from Uruguay (92.5%, a difference of 0.020%). Similarly, the demographic groups most similar to Immigrants from Trinidad and Tobago are Navajo (92.3%, a difference of 0.070%), Barbadian (92.2%, a difference of 0.11%), West Indian (92.4%, a difference of 0.12%), Native/Alaskan (92.2%, a difference of 0.12%), and Trinidadian and Tobagonian (92.4%, a difference of 0.13%).
| Demographics | Rating | Rank | 10th Grade |
| Immigrants | South America | 0.4 /100 | #262 | Tragic 92.6% |
| Apache | 0.4 /100 | #263 | Tragic 92.6% |
| Peruvians | 0.4 /100 | #264 | Tragic 92.6% |
| Dutch West Indians | 0.4 /100 | #265 | Tragic 92.6% |
| Immigrants | Philippines | 0.4 /100 | #266 | Tragic 92.6% |
| Taiwanese | 0.3 /100 | #267 | Tragic 92.5% |
| Immigrants | Ghana | 0.3 /100 | #268 | Tragic 92.5% |
| Immigrants | Colombia | 0.3 /100 | #269 | Tragic 92.5% |
| Immigrants | Uruguay | 0.3 /100 | #270 | Tragic 92.5% |
| Immigrants | Eritrea | 0.3 /100 | #271 | Tragic 92.5% |
| Immigrants | Western Africa | 0.3 /100 | #272 | Tragic 92.5% |
| Trinidadians and Tobagonians | 0.2 /100 | #273 | Tragic 92.4% |
| Immigrants | Congo | 0.2 /100 | #274 | Tragic 92.4% |
| West Indians | 0.2 /100 | #275 | Tragic 92.4% |
| Immigrants | Trinidad and Tobago | 0.1 /100 | #276 | Tragic 92.3% |
| Navajo | 0.1 /100 | #277 | Tragic 92.3% |
| Barbadians | 0.1 /100 | #278 | Tragic 92.2% |
| Natives/Alaskans | 0.1 /100 | #279 | Tragic 92.2% |
| Malaysians | 0.1 /100 | #280 | Tragic 92.2% |
| Bangladeshis | 0.1 /100 | #281 | Tragic 92.2% |
| Immigrants | Peru | 0.1 /100 | #282 | Tragic 92.2% |