Immigrants from Ghana vs Immigrants from Trinidad and Tobago Disability Age Over 75
COMPARE
Immigrants from Ghana
Immigrants from Trinidad and Tobago
Disability Age Over 75
Disability Age Over 75 Comparison
Immigrants from Ghana
Immigrants from Trinidad and Tobago
47.7%
DISABILITY AGE OVER 75
19.1/ 100
METRIC RATING
205th/ 347
METRIC RANK
47.6%
DISABILITY AGE OVER 75
25.3/ 100
METRIC RATING
195th/ 347
METRIC RANK
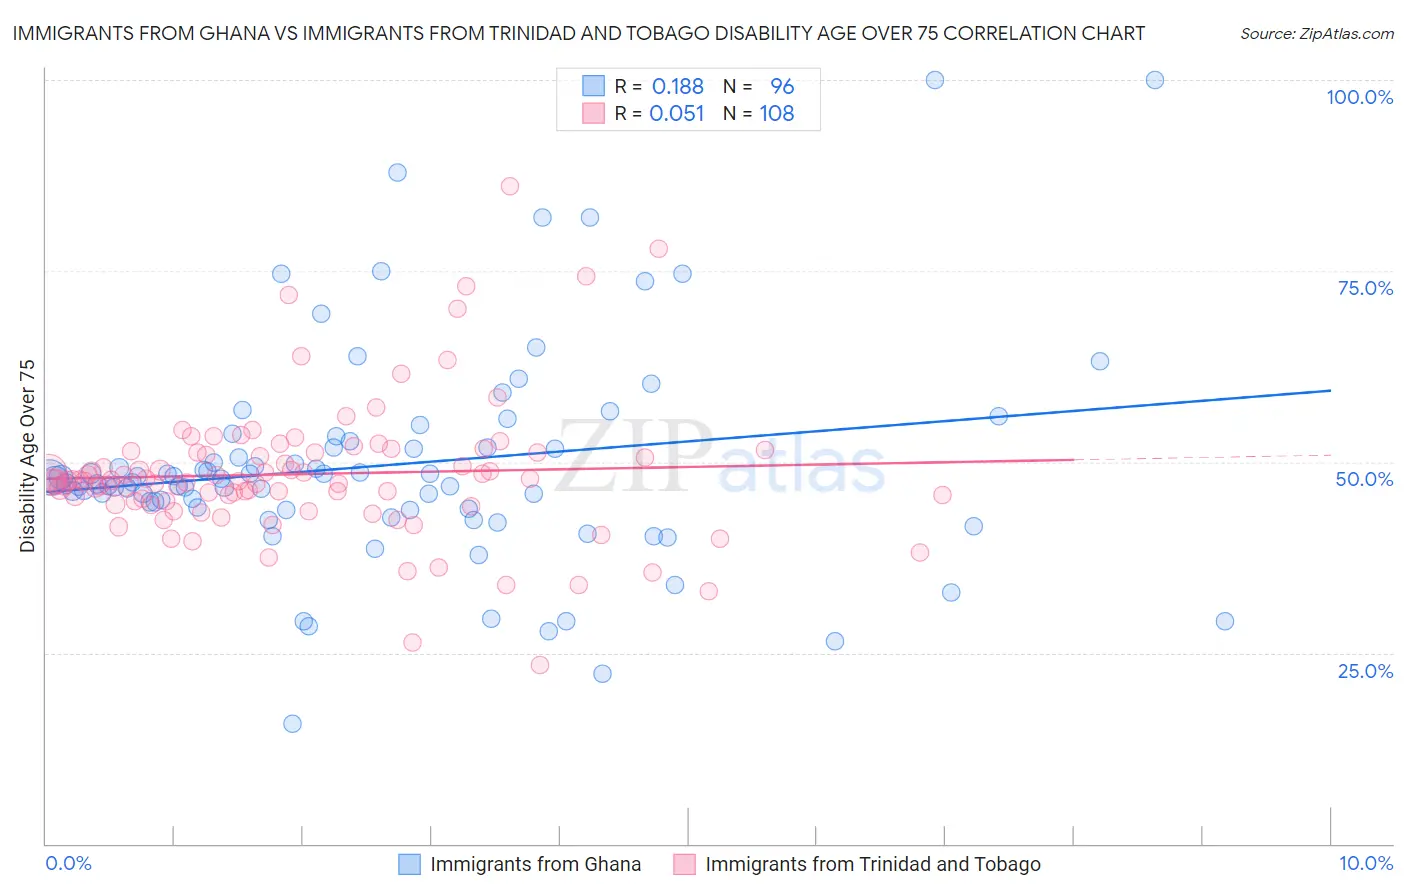
Immigrants from Ghana vs Immigrants from Trinidad and Tobago Disability Age Over 75 Correlation Chart
The statistical analysis conducted on geographies consisting of 199,494,871 people shows a poor positive correlation between the proportion of Immigrants from Ghana and percentage of population with a disability over the age of 75 in the United States with a correlation coefficient (R) of 0.188 and weighted average of 47.7%. Similarly, the statistical analysis conducted on geographies consisting of 223,345,670 people shows a slight positive correlation between the proportion of Immigrants from Trinidad and Tobago and percentage of population with a disability over the age of 75 in the United States with a correlation coefficient (R) of 0.051 and weighted average of 47.6%, a difference of 0.20%.
Disability Age Over 75 Correlation Summary
| Measurement | Immigrants from Ghana | Immigrants from Trinidad and Tobago |
| Minimum | 15.7% | 23.3% |
| Maximum | 100.0% | 86.1% |
| Range | 84.3% | 62.8% |
| Mean | 49.6% | 48.4% |
| Median | 47.4% | 47.4% |
| Interquartile 25% (IQ1) | 43.8% | 44.7% |
| Interquartile 75% (IQ3) | 52.3% | 51.2% |
| Interquartile Range (IQR) | 8.6% | 6.6% |
| Standard Deviation (Sample) | 14.4% | 9.2% |
| Standard Deviation (Population) | 14.3% | 9.1% |
Demographics Similar to Immigrants from Ghana and Immigrants from Trinidad and Tobago by Disability Age Over 75
In terms of disability age over 75, the demographic groups most similar to Immigrants from Ghana are Jamaican (47.7%, a difference of 0.0%), Nigerian (47.7%, a difference of 0.010%), Trinidadian and Tobagonian (47.7%, a difference of 0.030%), Immigrants from Cuba (47.7%, a difference of 0.060%), and Immigrants from Bahamas (47.7%, a difference of 0.060%). Similarly, the demographic groups most similar to Immigrants from Trinidad and Tobago are Immigrants from Lebanon (47.6%, a difference of 0.030%), Immigrants from Portugal (47.6%, a difference of 0.050%), Pakistani (47.7%, a difference of 0.060%), Immigrants from Ukraine (47.7%, a difference of 0.060%), and Immigrants from Jamaica (47.6%, a difference of 0.080%).
| Demographics | Rating | Rank | Disability Age Over 75 |
| Somalis | 29.5 /100 | #190 | Fair 47.6% |
| Portuguese | 29.3 /100 | #191 | Fair 47.6% |
| Immigrants | Jamaica | 28.3 /100 | #192 | Fair 47.6% |
| Ottawa | 28.1 /100 | #193 | Fair 47.6% |
| Immigrants | Lebanon | 26.5 /100 | #194 | Fair 47.6% |
| Immigrants | Trinidad and Tobago | 25.3 /100 | #195 | Fair 47.6% |
| Immigrants | Portugal | 23.8 /100 | #196 | Fair 47.6% |
| Pakistanis | 23.4 /100 | #197 | Fair 47.7% |
| Immigrants | Ukraine | 23.2 /100 | #198 | Fair 47.7% |
| Immigrants | Eritrea | 22.4 /100 | #199 | Fair 47.7% |
| Immigrants | Somalia | 21.4 /100 | #200 | Fair 47.7% |
| Immigrants | Cuba | 20.9 /100 | #201 | Fair 47.7% |
| Immigrants | Bahamas | 20.7 /100 | #202 | Fair 47.7% |
| Trinidadians and Tobagonians | 20.0 /100 | #203 | Fair 47.7% |
| Nigerians | 19.2 /100 | #204 | Poor 47.7% |
| Immigrants | Ghana | 19.1 /100 | #205 | Poor 47.7% |
| Jamaicans | 19.0 /100 | #206 | Poor 47.7% |
| Immigrants | Syria | 17.4 /100 | #207 | Poor 47.8% |
| Immigrants | Senegal | 16.9 /100 | #208 | Poor 47.8% |
| Immigrants | Indonesia | 14.2 /100 | #209 | Poor 47.8% |
| Vietnamese | 11.9 /100 | #210 | Poor 47.9% |