Immigrants from Germany vs Croatian 4 or more Vehicles in Household
COMPARE
Immigrants from Germany
Croatian
4 or more Vehicles in Household
4 or more Vehicles in Household Comparison
Immigrants from Germany
Croatians
6.8%
4 OR MORE VEHICLES IN HOUSEHOLD
94.7/ 100
METRIC RATING
121st/ 347
METRIC RANK
6.5%
4 OR MORE VEHICLES IN HOUSEHOLD
77.8/ 100
METRIC RATING
145th/ 347
METRIC RANK
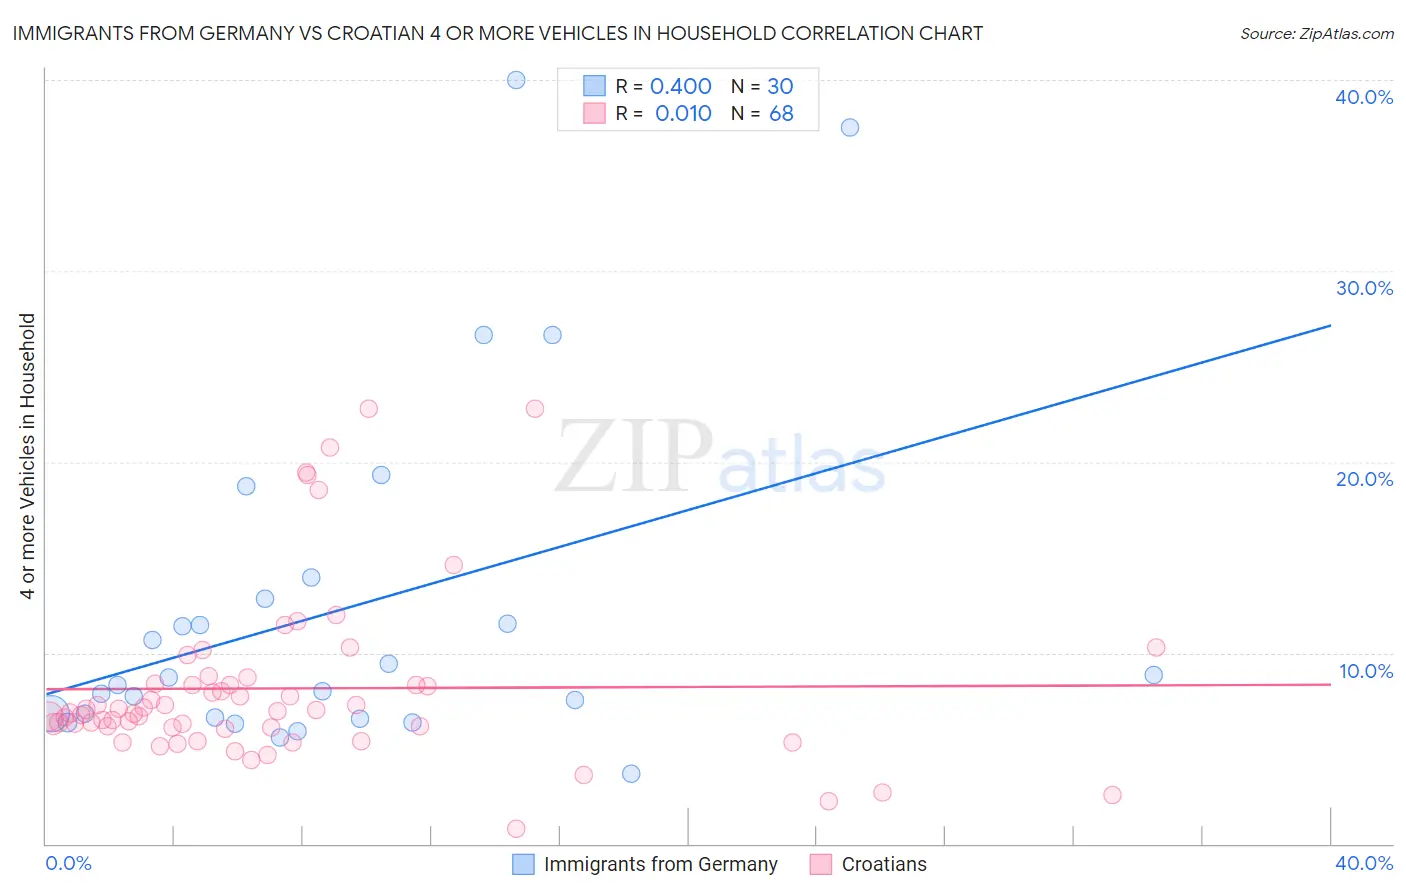
Immigrants from Germany vs Croatian 4 or more Vehicles in Household Correlation Chart
The statistical analysis conducted on geographies consisting of 462,058,551 people shows a mild positive correlation between the proportion of Immigrants from Germany and percentage of households with 4 or more vehicles available in the United States with a correlation coefficient (R) of 0.400 and weighted average of 6.8%. Similarly, the statistical analysis conducted on geographies consisting of 374,283,631 people shows no correlation between the proportion of Croatians and percentage of households with 4 or more vehicles available in the United States with a correlation coefficient (R) of 0.010 and weighted average of 6.5%, a difference of 4.0%.
4 or more Vehicles in Household Correlation Summary
| Measurement | Immigrants from Germany | Croatian |
| Minimum | 3.7% | 0.78% |
| Maximum | 40.0% | 22.8% |
| Range | 36.3% | 22.0% |
| Mean | 12.3% | 8.1% |
| Median | 8.5% | 6.9% |
| Interquartile 25% (IQ1) | 6.6% | 6.1% |
| Interquartile 75% (IQ3) | 12.8% | 8.3% |
| Interquartile Range (IQR) | 6.2% | 2.3% |
| Standard Deviation (Sample) | 9.2% | 4.5% |
| Standard Deviation (Population) | 9.0% | 4.5% |
Similar Demographics by 4 or more Vehicles in Household
Demographics Similar to Immigrants from Germany by 4 or more Vehicles in Household
In terms of 4 or more vehicles in household, the demographic groups most similar to Immigrants from Germany are Immigrants from Nicaragua (6.8%, a difference of 0.0%), Comanche (6.8%, a difference of 0.060%), Immigrants (6.8%, a difference of 0.070%), Immigrants from Asia (6.8%, a difference of 0.16%), and Austrian (6.8%, a difference of 0.26%).
| Demographics | Rating | Rank | 4 or more Vehicles in Household |
| Bolivians | 96.3 /100 | #114 | Exceptional 6.8% |
| Tlingit-Haida | 96.2 /100 | #115 | Exceptional 6.8% |
| Immigrants | Guatemala | 95.8 /100 | #116 | Exceptional 6.8% |
| Burmese | 95.7 /100 | #117 | Exceptional 6.8% |
| French American Indians | 95.7 /100 | #118 | Exceptional 6.8% |
| Costa Ricans | 95.5 /100 | #119 | Exceptional 6.8% |
| Comanche | 94.8 /100 | #120 | Exceptional 6.8% |
| Immigrants | Germany | 94.7 /100 | #121 | Exceptional 6.8% |
| Immigrants | Nicaragua | 94.7 /100 | #122 | Exceptional 6.8% |
| Immigrants | Immigrants | 94.6 /100 | #123 | Exceptional 6.8% |
| Immigrants | Asia | 94.4 /100 | #124 | Exceptional 6.8% |
| Austrians | 94.1 /100 | #125 | Exceptional 6.8% |
| Belgians | 94.1 /100 | #126 | Exceptional 6.8% |
| Immigrants | Korea | 93.8 /100 | #127 | Exceptional 6.8% |
| Immigrants | Bolivia | 92.5 /100 | #128 | Exceptional 6.7% |
Demographics Similar to Croatians by 4 or more Vehicles in Household
In terms of 4 or more vehicles in household, the demographic groups most similar to Croatians are Immigrants from North America (6.5%, a difference of 0.10%), Immigrants from Canada (6.5%, a difference of 0.11%), Immigrants from Iraq (6.5%, a difference of 0.25%), Australian (6.6%, a difference of 0.45%), and Immigrants from Costa Rica (6.5%, a difference of 0.46%).
| Demographics | Rating | Rank | 4 or more Vehicles in Household |
| Italians | 84.5 /100 | #138 | Excellent 6.6% |
| Jordanians | 82.1 /100 | #139 | Excellent 6.6% |
| Slavs | 81.6 /100 | #140 | Excellent 6.6% |
| Australians | 80.8 /100 | #141 | Excellent 6.6% |
| Immigrants | Iraq | 79.4 /100 | #142 | Good 6.5% |
| Immigrants | Canada | 78.6 /100 | #143 | Good 6.5% |
| Immigrants | North America | 78.5 /100 | #144 | Good 6.5% |
| Croatians | 77.8 /100 | #145 | Good 6.5% |
| Immigrants | Costa Rica | 74.4 /100 | #146 | Good 6.5% |
| Immigrants | Iran | 73.9 /100 | #147 | Good 6.5% |
| Immigrants | Jordan | 73.7 /100 | #148 | Good 6.5% |
| Greeks | 73.6 /100 | #149 | Good 6.5% |
| New Zealanders | 73.3 /100 | #150 | Good 6.5% |
| Immigrants | Hong Kong | 72.2 /100 | #151 | Good 6.5% |
| Yuman | 72.1 /100 | #152 | Good 6.5% |