Immigrants from Eritrea vs Immigrants from St. Vincent and the Grenadines 4 or more Vehicles in Household
COMPARE
Immigrants from Eritrea
Immigrants from St. Vincent and the Grenadines
4 or more Vehicles in Household
4 or more Vehicles in Household Comparison
Immigrants from Eritrea
Immigrants from St. Vincent and the Grenadines
5.8%
4 OR MORE VEHICLES IN HOUSEHOLD
4.5/ 100
METRIC RATING
236th/ 347
METRIC RANK
3.0%
4 OR MORE VEHICLES IN HOUSEHOLD
0.0/ 100
METRIC RATING
346th/ 347
METRIC RANK
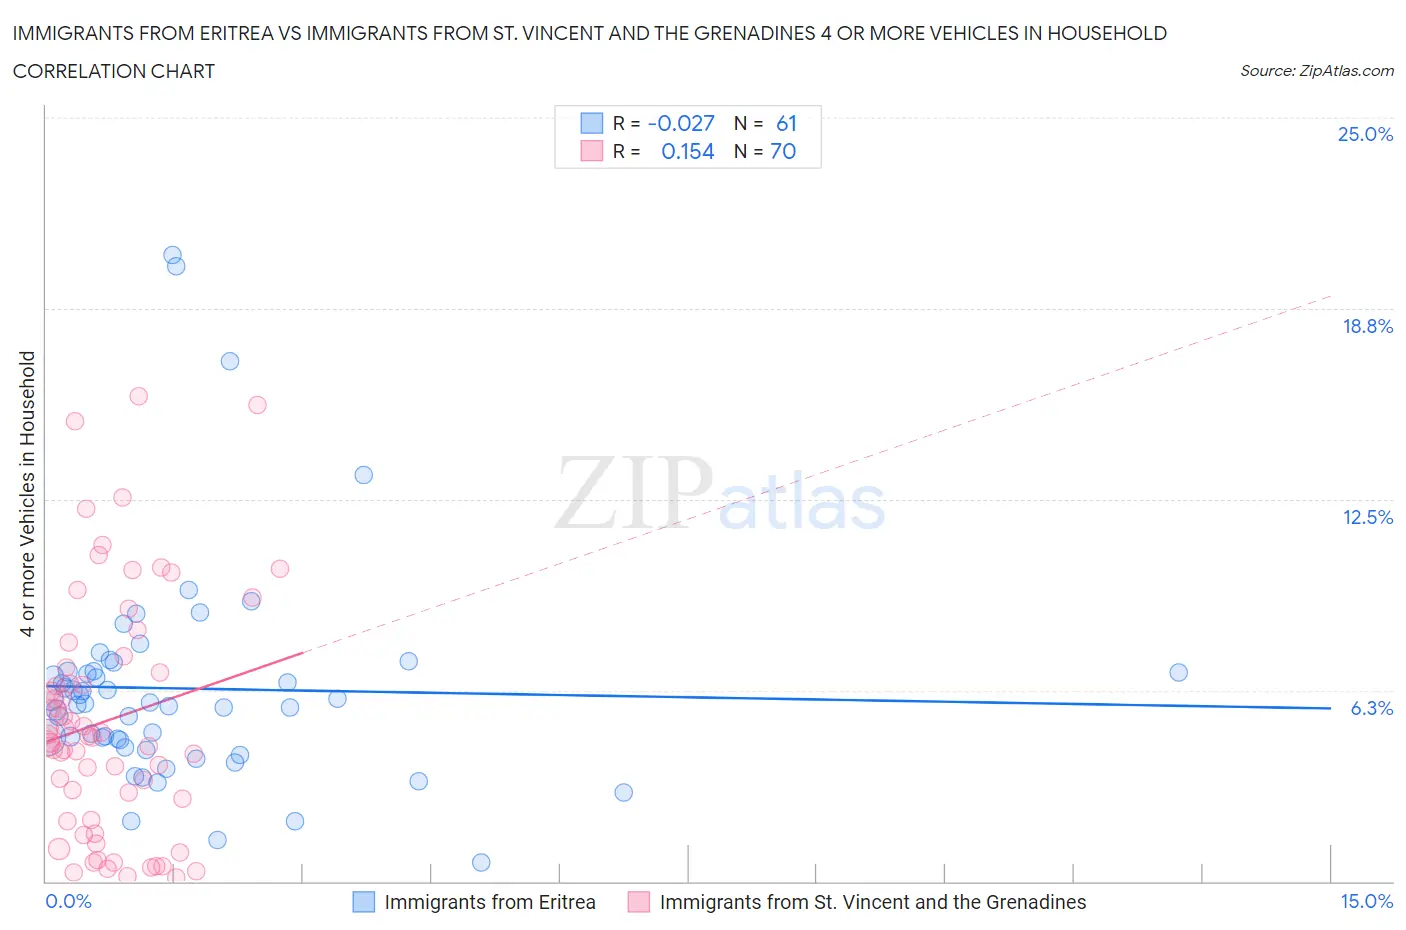
Immigrants from Eritrea vs Immigrants from St. Vincent and the Grenadines 4 or more Vehicles in Household Correlation Chart
The statistical analysis conducted on geographies consisting of 104,728,093 people shows no correlation between the proportion of Immigrants from Eritrea and percentage of households with 4 or more vehicles available in the United States with a correlation coefficient (R) of -0.027 and weighted average of 5.8%. Similarly, the statistical analysis conducted on geographies consisting of 55,957,136 people shows a poor positive correlation between the proportion of Immigrants from St. Vincent and the Grenadines and percentage of households with 4 or more vehicles available in the United States with a correlation coefficient (R) of 0.154 and weighted average of 3.0%, a difference of 96.7%.
4 or more Vehicles in Household Correlation Summary
| Measurement | Immigrants from Eritrea | Immigrants from St. Vincent and the Grenadines |
| Minimum | 0.61% | 0.11% |
| Maximum | 20.5% | 15.9% |
| Range | 19.9% | 15.8% |
| Mean | 6.3% | 5.3% |
| Median | 5.8% | 4.7% |
| Interquartile 25% (IQ1) | 4.5% | 2.0% |
| Interquartile 75% (IQ3) | 6.9% | 7.0% |
| Interquartile Range (IQR) | 2.4% | 5.0% |
| Standard Deviation (Sample) | 3.6% | 3.9% |
| Standard Deviation (Population) | 3.6% | 3.9% |
Similar Demographics by 4 or more Vehicles in Household
Demographics Similar to Immigrants from Eritrea by 4 or more Vehicles in Household
In terms of 4 or more vehicles in household, the demographic groups most similar to Immigrants from Eritrea are Immigrants from Hungary (5.8%, a difference of 0.010%), African (5.8%, a difference of 0.030%), Turkish (5.8%, a difference of 0.27%), Immigrants from Belgium (5.8%, a difference of 0.40%), and Immigrants from Australia (5.8%, a difference of 0.49%).
| Demographics | Rating | Rank | 4 or more Vehicles in Household |
| Eastern Europeans | 6.8 /100 | #229 | Tragic 5.9% |
| Immigrants | Malaysia | 6.7 /100 | #230 | Tragic 5.9% |
| Immigrants | Switzerland | 6.4 /100 | #231 | Tragic 5.9% |
| Immigrants | Argentina | 6.0 /100 | #232 | Tragic 5.9% |
| Sierra Leoneans | 6.0 /100 | #233 | Tragic 5.9% |
| Africans | 4.6 /100 | #234 | Tragic 5.8% |
| Immigrants | Hungary | 4.6 /100 | #235 | Tragic 5.8% |
| Immigrants | Eritrea | 4.5 /100 | #236 | Tragic 5.8% |
| Turks | 4.1 /100 | #237 | Tragic 5.8% |
| Immigrants | Belgium | 4.0 /100 | #238 | Tragic 5.8% |
| Immigrants | Australia | 3.8 /100 | #239 | Tragic 5.8% |
| Immigrants | Poland | 3.8 /100 | #240 | Tragic 5.8% |
| Mongolians | 3.7 /100 | #241 | Tragic 5.8% |
| Immigrants | Middle Africa | 3.4 /100 | #242 | Tragic 5.8% |
| Immigrants | Czechoslovakia | 3.2 /100 | #243 | Tragic 5.8% |
Demographics Similar to Immigrants from St. Vincent and the Grenadines by 4 or more Vehicles in Household
In terms of 4 or more vehicles in household, the demographic groups most similar to Immigrants from St. Vincent and the Grenadines are Immigrants from Grenada (2.7%, a difference of 8.5%), Immigrants from Dominican Republic (3.3%, a difference of 10.0%), Immigrants from Guyana (3.4%, a difference of 14.5%), British West Indian (3.5%, a difference of 16.3%), and Guyanese (3.5%, a difference of 17.4%).
| Demographics | Rating | Rank | 4 or more Vehicles in Household |
| Immigrants | Albania | 0.0 /100 | #333 | Tragic 4.1% |
| Immigrants | Trinidad and Tobago | 0.0 /100 | #334 | Tragic 4.1% |
| Barbadians | 0.0 /100 | #335 | Tragic 3.9% |
| Immigrants | Bangladesh | 0.0 /100 | #336 | Tragic 3.9% |
| Vietnamese | 0.0 /100 | #337 | Tragic 3.9% |
| Immigrants | Cabo Verde | 0.0 /100 | #338 | Tragic 3.8% |
| Immigrants | Uzbekistan | 0.0 /100 | #339 | Tragic 3.6% |
| Immigrants | Barbados | 0.0 /100 | #340 | Tragic 3.6% |
| Dominicans | 0.0 /100 | #341 | Tragic 3.5% |
| Guyanese | 0.0 /100 | #342 | Tragic 3.5% |
| British West Indians | 0.0 /100 | #343 | Tragic 3.5% |
| Immigrants | Guyana | 0.0 /100 | #344 | Tragic 3.4% |
| Immigrants | Dominican Republic | 0.0 /100 | #345 | Tragic 3.3% |
| Immigrants | St. Vincent and the Grenadines | 0.0 /100 | #346 | Tragic 3.0% |
| Immigrants | Grenada | 0.0 /100 | #347 | Tragic 2.7% |