Immigrants from El Salvador vs Cypriot Male Disability
COMPARE
Immigrants from El Salvador
Cypriot
Male Disability
Male Disability Comparison
Immigrants from El Salvador
Cypriots
10.3%
MALE DISABILITY
99.7/ 100
METRIC RATING
44th/ 347
METRIC RANK
10.0%
MALE DISABILITY
100.0/ 100
METRIC RATING
23rd/ 347
METRIC RANK
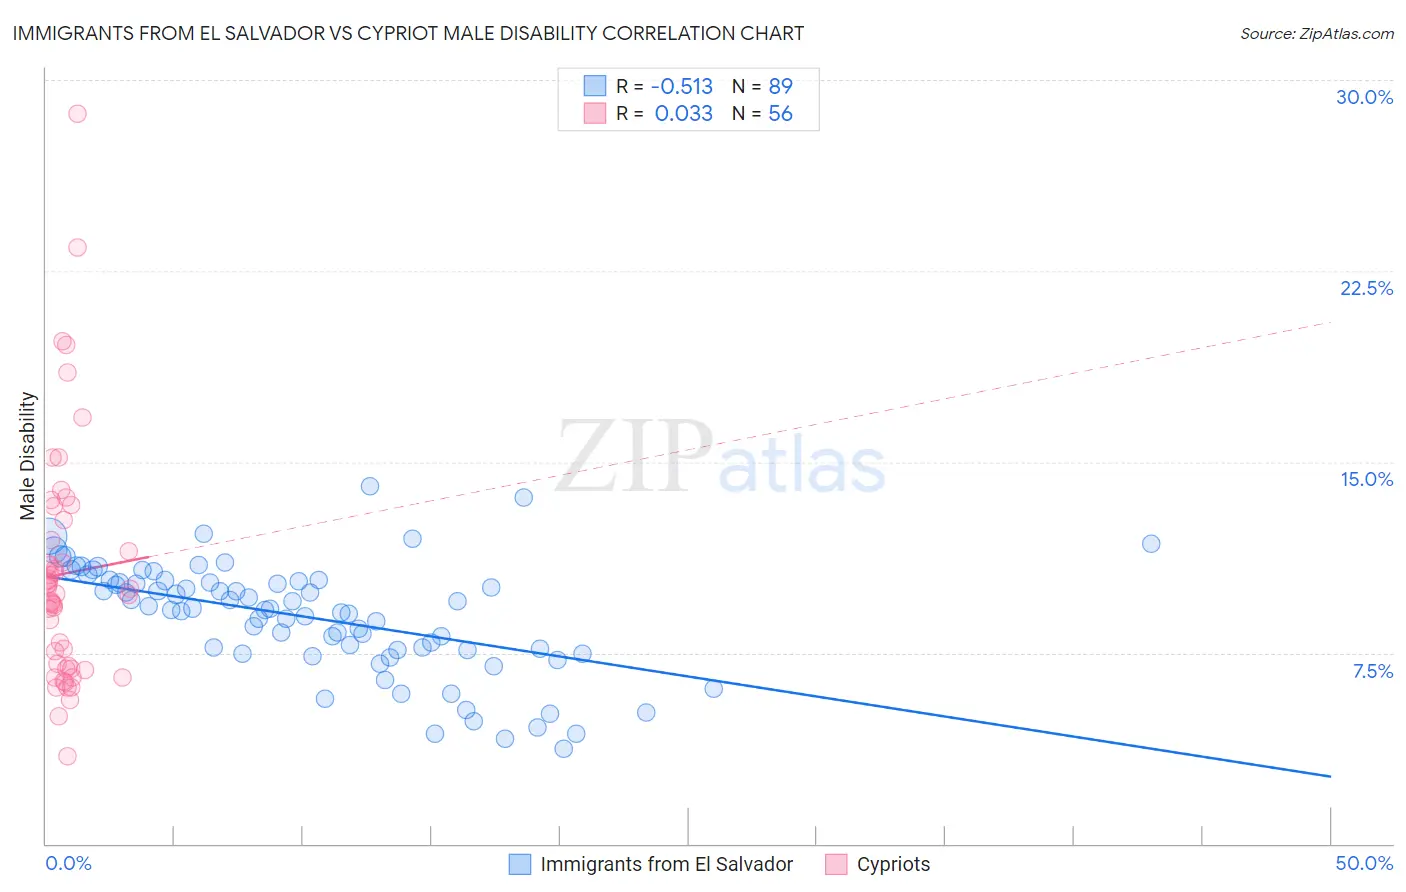
Immigrants from El Salvador vs Cypriot Male Disability Correlation Chart
The statistical analysis conducted on geographies consisting of 357,750,884 people shows a substantial negative correlation between the proportion of Immigrants from El Salvador and percentage of males with a disability in the United States with a correlation coefficient (R) of -0.513 and weighted average of 10.3%. Similarly, the statistical analysis conducted on geographies consisting of 61,868,977 people shows no correlation between the proportion of Cypriots and percentage of males with a disability in the United States with a correlation coefficient (R) of 0.033 and weighted average of 10.0%, a difference of 2.9%.
Male Disability Correlation Summary
| Measurement | Immigrants from El Salvador | Cypriot |
| Minimum | 3.7% | 3.4% |
| Maximum | 14.1% | 28.7% |
| Range | 10.4% | 25.3% |
| Mean | 8.9% | 10.6% |
| Median | 9.2% | 9.9% |
| Interquartile 25% (IQ1) | 7.6% | 6.9% |
| Interquartile 75% (IQ3) | 10.3% | 12.3% |
| Interquartile Range (IQR) | 2.7% | 5.4% |
| Standard Deviation (Sample) | 2.2% | 4.7% |
| Standard Deviation (Population) | 2.2% | 4.6% |
Similar Demographics by Male Disability
Demographics Similar to Immigrants from El Salvador by Male Disability
In terms of male disability, the demographic groups most similar to Immigrants from El Salvador are Turkish (10.3%, a difference of 0.0%), Immigrants from Bangladesh (10.3%, a difference of 0.070%), Mongolian (10.3%, a difference of 0.090%), Cambodian (10.3%, a difference of 0.090%), and Immigrants from Peru (10.3%, a difference of 0.12%).
| Demographics | Rating | Rank | Male Disability |
| Immigrants | Indonesia | 99.8 /100 | #37 | Exceptional 10.2% |
| Immigrants | Kuwait | 99.8 /100 | #38 | Exceptional 10.2% |
| Afghans | 99.8 /100 | #39 | Exceptional 10.2% |
| Immigrants | Nepal | 99.8 /100 | #40 | Exceptional 10.3% |
| Taiwanese | 99.8 /100 | #41 | Exceptional 10.3% |
| Mongolians | 99.7 /100 | #42 | Exceptional 10.3% |
| Immigrants | Bangladesh | 99.7 /100 | #43 | Exceptional 10.3% |
| Immigrants | El Salvador | 99.7 /100 | #44 | Exceptional 10.3% |
| Turks | 99.7 /100 | #45 | Exceptional 10.3% |
| Cambodians | 99.7 /100 | #46 | Exceptional 10.3% |
| Immigrants | Peru | 99.7 /100 | #47 | Exceptional 10.3% |
| Israelis | 99.7 /100 | #48 | Exceptional 10.3% |
| Immigrants | Spain | 99.7 /100 | #49 | Exceptional 10.3% |
| South Americans | 99.6 /100 | #50 | Exceptional 10.3% |
| Salvadorans | 99.6 /100 | #51 | Exceptional 10.4% |
Demographics Similar to Cypriots by Male Disability
In terms of male disability, the demographic groups most similar to Cypriots are Immigrants from Venezuela (10.0%, a difference of 0.090%), Immigrants from Asia (10.0%, a difference of 0.14%), Immigrants from Malaysia (10.0%, a difference of 0.32%), Burmese (10.0%, a difference of 0.38%), and Paraguayan (10.1%, a difference of 0.45%).
| Demographics | Rating | Rank | Male Disability |
| Okinawans | 100.0 /100 | #16 | Exceptional 9.8% |
| Immigrants | Korea | 100.0 /100 | #17 | Exceptional 9.8% |
| Immigrants | Pakistan | 100.0 /100 | #18 | Exceptional 9.8% |
| Immigrants | Sri Lanka | 100.0 /100 | #19 | Exceptional 10.0% |
| Asians | 100.0 /100 | #20 | Exceptional 10.0% |
| Burmese | 100.0 /100 | #21 | Exceptional 10.0% |
| Immigrants | Venezuela | 100.0 /100 | #22 | Exceptional 10.0% |
| Cypriots | 100.0 /100 | #23 | Exceptional 10.0% |
| Immigrants | Asia | 100.0 /100 | #24 | Exceptional 10.0% |
| Immigrants | Malaysia | 99.9 /100 | #25 | Exceptional 10.0% |
| Paraguayans | 99.9 /100 | #26 | Exceptional 10.1% |
| Egyptians | 99.9 /100 | #27 | Exceptional 10.1% |
| Vietnamese | 99.9 /100 | #28 | Exceptional 10.1% |
| Venezuelans | 99.9 /100 | #29 | Exceptional 10.1% |
| Immigrants | Egypt | 99.9 /100 | #30 | Exceptional 10.1% |