Immigrants from Ecuador vs Immigrants from Panama 4 or more Vehicles in Household
COMPARE
Immigrants from Ecuador
Immigrants from Panama
4 or more Vehicles in Household
4 or more Vehicles in Household Comparison
Immigrants from Ecuador
Immigrants from Panama
4.2%
4 OR MORE VEHICLES IN HOUSEHOLD
0.0/ 100
METRIC RATING
330th/ 347
METRIC RANK
5.7%
4 OR MORE VEHICLES IN HOUSEHOLD
1.5/ 100
METRIC RATING
254th/ 347
METRIC RANK
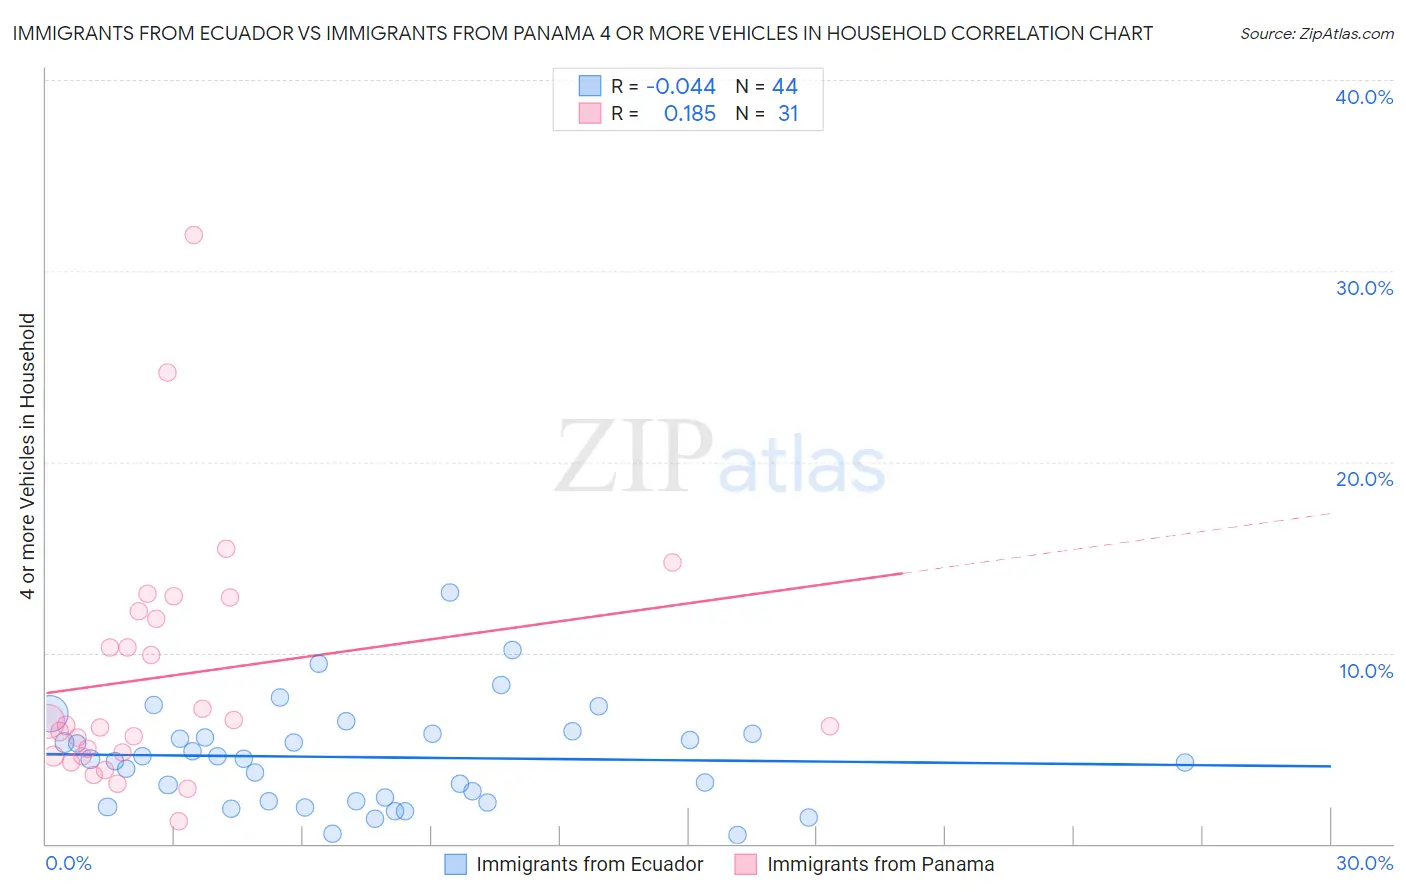
Immigrants from Ecuador vs Immigrants from Panama 4 or more Vehicles in Household Correlation Chart
The statistical analysis conducted on geographies consisting of 269,639,406 people shows no correlation between the proportion of Immigrants from Ecuador and percentage of households with 4 or more vehicles available in the United States with a correlation coefficient (R) of -0.044 and weighted average of 4.2%. Similarly, the statistical analysis conducted on geographies consisting of 220,402,511 people shows a poor positive correlation between the proportion of Immigrants from Panama and percentage of households with 4 or more vehicles available in the United States with a correlation coefficient (R) of 0.185 and weighted average of 5.7%, a difference of 33.7%.
4 or more Vehicles in Household Correlation Summary
| Measurement | Immigrants from Ecuador | Immigrants from Panama |
| Minimum | 0.44% | 1.2% |
| Maximum | 13.2% | 31.9% |
| Range | 12.7% | 30.7% |
| Mean | 4.5% | 8.8% |
| Median | 4.4% | 6.2% |
| Interquartile 25% (IQ1) | 2.2% | 4.6% |
| Interquartile 75% (IQ3) | 5.8% | 12.2% |
| Interquartile Range (IQR) | 3.5% | 7.6% |
| Standard Deviation (Sample) | 2.7% | 6.5% |
| Standard Deviation (Population) | 2.6% | 6.4% |
Similar Demographics by 4 or more Vehicles in Household
Demographics Similar to Immigrants from Ecuador by 4 or more Vehicles in Household
In terms of 4 or more vehicles in household, the demographic groups most similar to Immigrants from Ecuador are Immigrants from Senegal (4.2%, a difference of 0.20%), West Indian (4.2%, a difference of 0.26%), Trinidadian and Tobagonian (4.3%, a difference of 0.47%), Immigrants from Dominica (4.2%, a difference of 1.2%), and Senegalese (4.3%, a difference of 2.1%).
| Demographics | Rating | Rank | 4 or more Vehicles in Household |
| Immigrants | Caribbean | 0.0 /100 | #323 | Tragic 4.4% |
| Soviet Union | 0.0 /100 | #324 | Tragic 4.4% |
| Immigrants | Jamaica | 0.0 /100 | #325 | Tragic 4.4% |
| Cape Verdeans | 0.0 /100 | #326 | Tragic 4.4% |
| Senegalese | 0.0 /100 | #327 | Tragic 4.3% |
| Trinidadians and Tobagonians | 0.0 /100 | #328 | Tragic 4.3% |
| Immigrants | Senegal | 0.0 /100 | #329 | Tragic 4.2% |
| Immigrants | Ecuador | 0.0 /100 | #330 | Tragic 4.2% |
| West Indians | 0.0 /100 | #331 | Tragic 4.2% |
| Immigrants | Dominica | 0.0 /100 | #332 | Tragic 4.2% |
| Immigrants | Albania | 0.0 /100 | #333 | Tragic 4.1% |
| Immigrants | Trinidad and Tobago | 0.0 /100 | #334 | Tragic 4.1% |
| Barbadians | 0.0 /100 | #335 | Tragic 3.9% |
| Immigrants | Bangladesh | 0.0 /100 | #336 | Tragic 3.9% |
| Vietnamese | 0.0 /100 | #337 | Tragic 3.9% |
Demographics Similar to Immigrants from Panama by 4 or more Vehicles in Household
In terms of 4 or more vehicles in household, the demographic groups most similar to Immigrants from Panama are Yup'ik (5.7%, a difference of 0.090%), Immigrants from Turkey (5.7%, a difference of 0.12%), Immigrants from Cuba (5.7%, a difference of 0.14%), Immigrants from Northern Africa (5.6%, a difference of 0.20%), and Immigrants from Lithuania (5.6%, a difference of 0.34%).
| Demographics | Rating | Rank | 4 or more Vehicles in Household |
| Immigrants | Ethiopia | 2.4 /100 | #247 | Tragic 5.7% |
| Immigrants | Eastern Africa | 2.4 /100 | #248 | Tragic 5.7% |
| Immigrants | Southern Europe | 2.3 /100 | #249 | Tragic 5.7% |
| Immigrants | Europe | 2.3 /100 | #250 | Tragic 5.7% |
| Ugandans | 2.2 /100 | #251 | Tragic 5.7% |
| Sub-Saharan Africans | 2.1 /100 | #252 | Tragic 5.7% |
| Immigrants | Cuba | 1.6 /100 | #253 | Tragic 5.7% |
| Immigrants | Panama | 1.5 /100 | #254 | Tragic 5.7% |
| Yup'ik | 1.5 /100 | #255 | Tragic 5.7% |
| Immigrants | Turkey | 1.5 /100 | #256 | Tragic 5.7% |
| Immigrants | Northern Africa | 1.4 /100 | #257 | Tragic 5.6% |
| Immigrants | Lithuania | 1.4 /100 | #258 | Tragic 5.6% |
| Immigrants | France | 1.3 /100 | #259 | Tragic 5.6% |
| Uruguayans | 1.3 /100 | #260 | Tragic 5.6% |
| Sudanese | 1.2 /100 | #261 | Tragic 5.6% |