Immigrants from Ecuador vs Immigrants from Argentina 4 or more Vehicles in Household
COMPARE
Immigrants from Ecuador
Immigrants from Argentina
4 or more Vehicles in Household
4 or more Vehicles in Household Comparison
Immigrants from Ecuador
Immigrants from Argentina
4.2%
4 OR MORE VEHICLES IN HOUSEHOLD
0.0/ 100
METRIC RATING
330th/ 347
METRIC RANK
5.9%
4 OR MORE VEHICLES IN HOUSEHOLD
6.0/ 100
METRIC RATING
232nd/ 347
METRIC RANK
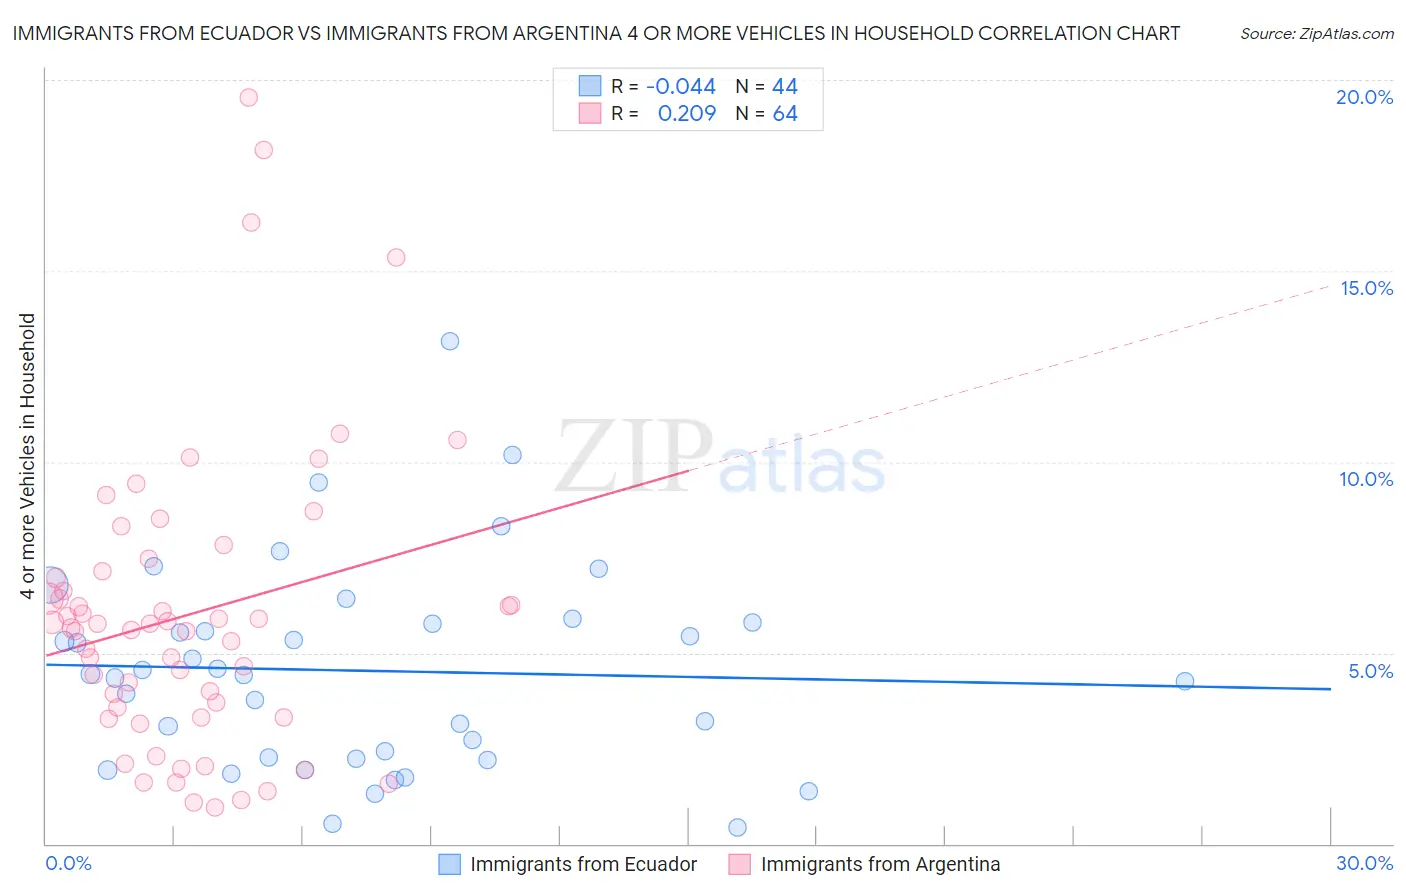
Immigrants from Ecuador vs Immigrants from Argentina 4 or more Vehicles in Household Correlation Chart
The statistical analysis conducted on geographies consisting of 269,639,406 people shows no correlation between the proportion of Immigrants from Ecuador and percentage of households with 4 or more vehicles available in the United States with a correlation coefficient (R) of -0.044 and weighted average of 4.2%. Similarly, the statistical analysis conducted on geographies consisting of 263,256,749 people shows a weak positive correlation between the proportion of Immigrants from Argentina and percentage of households with 4 or more vehicles available in the United States with a correlation coefficient (R) of 0.209 and weighted average of 5.9%, a difference of 39.0%.
4 or more Vehicles in Household Correlation Summary
| Measurement | Immigrants from Ecuador | Immigrants from Argentina |
| Minimum | 0.44% | 0.94% |
| Maximum | 13.2% | 19.5% |
| Range | 12.7% | 18.6% |
| Mean | 4.5% | 6.0% |
| Median | 4.4% | 5.7% |
| Interquartile 25% (IQ1) | 2.2% | 3.4% |
| Interquartile 75% (IQ3) | 5.8% | 7.1% |
| Interquartile Range (IQR) | 3.5% | 3.6% |
| Standard Deviation (Sample) | 2.7% | 3.9% |
| Standard Deviation (Population) | 2.6% | 3.8% |
Similar Demographics by 4 or more Vehicles in Household
Demographics Similar to Immigrants from Ecuador by 4 or more Vehicles in Household
In terms of 4 or more vehicles in household, the demographic groups most similar to Immigrants from Ecuador are Immigrants from Senegal (4.2%, a difference of 0.20%), West Indian (4.2%, a difference of 0.26%), Trinidadian and Tobagonian (4.3%, a difference of 0.47%), Immigrants from Dominica (4.2%, a difference of 1.2%), and Senegalese (4.3%, a difference of 2.1%).
| Demographics | Rating | Rank | 4 or more Vehicles in Household |
| Immigrants | Caribbean | 0.0 /100 | #323 | Tragic 4.4% |
| Soviet Union | 0.0 /100 | #324 | Tragic 4.4% |
| Immigrants | Jamaica | 0.0 /100 | #325 | Tragic 4.4% |
| Cape Verdeans | 0.0 /100 | #326 | Tragic 4.4% |
| Senegalese | 0.0 /100 | #327 | Tragic 4.3% |
| Trinidadians and Tobagonians | 0.0 /100 | #328 | Tragic 4.3% |
| Immigrants | Senegal | 0.0 /100 | #329 | Tragic 4.2% |
| Immigrants | Ecuador | 0.0 /100 | #330 | Tragic 4.2% |
| West Indians | 0.0 /100 | #331 | Tragic 4.2% |
| Immigrants | Dominica | 0.0 /100 | #332 | Tragic 4.2% |
| Immigrants | Albania | 0.0 /100 | #333 | Tragic 4.1% |
| Immigrants | Trinidad and Tobago | 0.0 /100 | #334 | Tragic 4.1% |
| Barbadians | 0.0 /100 | #335 | Tragic 3.9% |
| Immigrants | Bangladesh | 0.0 /100 | #336 | Tragic 3.9% |
| Vietnamese | 0.0 /100 | #337 | Tragic 3.9% |
Demographics Similar to Immigrants from Argentina by 4 or more Vehicles in Household
In terms of 4 or more vehicles in household, the demographic groups most similar to Immigrants from Argentina are Sierra Leonean (5.9%, a difference of 0.010%), Immigrants from Switzerland (5.9%, a difference of 0.18%), Immigrants from Malaysia (5.9%, a difference of 0.30%), Eastern European (5.9%, a difference of 0.37%), and Immigrants from Uganda (5.9%, a difference of 0.65%).
| Demographics | Rating | Rank | 4 or more Vehicles in Household |
| Indonesians | 8.9 /100 | #225 | Tragic 6.0% |
| Immigrants | Singapore | 7.9 /100 | #226 | Tragic 5.9% |
| Immigrants | Western Asia | 7.8 /100 | #227 | Tragic 5.9% |
| Immigrants | Uganda | 7.5 /100 | #228 | Tragic 5.9% |
| Eastern Europeans | 6.8 /100 | #229 | Tragic 5.9% |
| Immigrants | Malaysia | 6.7 /100 | #230 | Tragic 5.9% |
| Immigrants | Switzerland | 6.4 /100 | #231 | Tragic 5.9% |
| Immigrants | Argentina | 6.0 /100 | #232 | Tragic 5.9% |
| Sierra Leoneans | 6.0 /100 | #233 | Tragic 5.9% |
| Africans | 4.6 /100 | #234 | Tragic 5.8% |
| Immigrants | Hungary | 4.6 /100 | #235 | Tragic 5.8% |
| Immigrants | Eritrea | 4.5 /100 | #236 | Tragic 5.8% |
| Turks | 4.1 /100 | #237 | Tragic 5.8% |
| Immigrants | Belgium | 4.0 /100 | #238 | Tragic 5.8% |
| Immigrants | Australia | 3.8 /100 | #239 | Tragic 5.8% |