Immigrants from Ecuador vs Greek 4 or more Vehicles in Household
COMPARE
Immigrants from Ecuador
Greek
4 or more Vehicles in Household
4 or more Vehicles in Household Comparison
Immigrants from Ecuador
Greeks
4.2%
4 OR MORE VEHICLES IN HOUSEHOLD
0.0/ 100
METRIC RATING
330th/ 347
METRIC RANK
6.5%
4 OR MORE VEHICLES IN HOUSEHOLD
73.6/ 100
METRIC RATING
149th/ 347
METRIC RANK
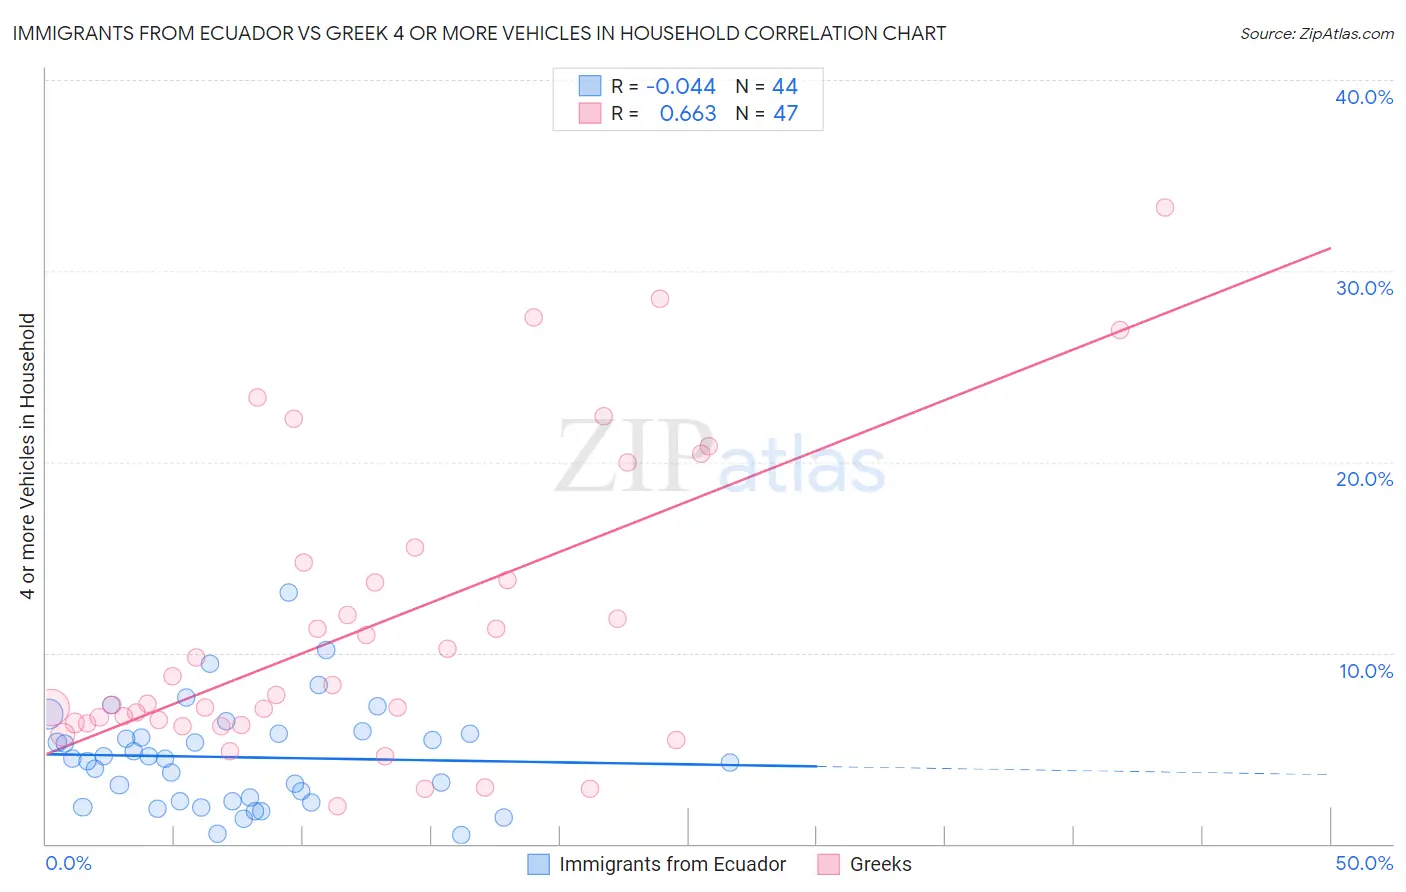
Immigrants from Ecuador vs Greek 4 or more Vehicles in Household Correlation Chart
The statistical analysis conducted on geographies consisting of 269,639,406 people shows no correlation between the proportion of Immigrants from Ecuador and percentage of households with 4 or more vehicles available in the United States with a correlation coefficient (R) of -0.044 and weighted average of 4.2%. Similarly, the statistical analysis conducted on geographies consisting of 480,370,844 people shows a significant positive correlation between the proportion of Greeks and percentage of households with 4 or more vehicles available in the United States with a correlation coefficient (R) of 0.663 and weighted average of 6.5%, a difference of 53.3%.
4 or more Vehicles in Household Correlation Summary
| Measurement | Immigrants from Ecuador | Greek |
| Minimum | 0.44% | 2.0% |
| Maximum | 13.2% | 33.3% |
| Range | 12.7% | 31.4% |
| Mean | 4.5% | 11.4% |
| Median | 4.4% | 7.8% |
| Interquartile 25% (IQ1) | 2.2% | 6.3% |
| Interquartile 75% (IQ3) | 5.8% | 14.7% |
| Interquartile Range (IQR) | 3.5% | 8.4% |
| Standard Deviation (Sample) | 2.7% | 7.8% |
| Standard Deviation (Population) | 2.6% | 7.7% |
Similar Demographics by 4 or more Vehicles in Household
Demographics Similar to Immigrants from Ecuador by 4 or more Vehicles in Household
In terms of 4 or more vehicles in household, the demographic groups most similar to Immigrants from Ecuador are Immigrants from Senegal (4.2%, a difference of 0.20%), West Indian (4.2%, a difference of 0.26%), Trinidadian and Tobagonian (4.3%, a difference of 0.47%), Immigrants from Dominica (4.2%, a difference of 1.2%), and Senegalese (4.3%, a difference of 2.1%).
| Demographics | Rating | Rank | 4 or more Vehicles in Household |
| Immigrants | Caribbean | 0.0 /100 | #323 | Tragic 4.4% |
| Soviet Union | 0.0 /100 | #324 | Tragic 4.4% |
| Immigrants | Jamaica | 0.0 /100 | #325 | Tragic 4.4% |
| Cape Verdeans | 0.0 /100 | #326 | Tragic 4.4% |
| Senegalese | 0.0 /100 | #327 | Tragic 4.3% |
| Trinidadians and Tobagonians | 0.0 /100 | #328 | Tragic 4.3% |
| Immigrants | Senegal | 0.0 /100 | #329 | Tragic 4.2% |
| Immigrants | Ecuador | 0.0 /100 | #330 | Tragic 4.2% |
| West Indians | 0.0 /100 | #331 | Tragic 4.2% |
| Immigrants | Dominica | 0.0 /100 | #332 | Tragic 4.2% |
| Immigrants | Albania | 0.0 /100 | #333 | Tragic 4.1% |
| Immigrants | Trinidad and Tobago | 0.0 /100 | #334 | Tragic 4.1% |
| Barbadians | 0.0 /100 | #335 | Tragic 3.9% |
| Immigrants | Bangladesh | 0.0 /100 | #336 | Tragic 3.9% |
| Vietnamese | 0.0 /100 | #337 | Tragic 3.9% |
Demographics Similar to Greeks by 4 or more Vehicles in Household
In terms of 4 or more vehicles in household, the demographic groups most similar to Greeks are Immigrants from Jordan (6.5%, a difference of 0.0%), Immigrants from Iran (6.5%, a difference of 0.040%), New Zealander (6.5%, a difference of 0.040%), Immigrants from Costa Rica (6.5%, a difference of 0.090%), and Immigrants from Hong Kong (6.5%, a difference of 0.18%).
| Demographics | Rating | Rank | 4 or more Vehicles in Household |
| Immigrants | Iraq | 79.4 /100 | #142 | Good 6.5% |
| Immigrants | Canada | 78.6 /100 | #143 | Good 6.5% |
| Immigrants | North America | 78.5 /100 | #144 | Good 6.5% |
| Croatians | 77.8 /100 | #145 | Good 6.5% |
| Immigrants | Costa Rica | 74.4 /100 | #146 | Good 6.5% |
| Immigrants | Iran | 73.9 /100 | #147 | Good 6.5% |
| Immigrants | Jordan | 73.7 /100 | #148 | Good 6.5% |
| Greeks | 73.6 /100 | #149 | Good 6.5% |
| New Zealanders | 73.3 /100 | #150 | Good 6.5% |
| Immigrants | Hong Kong | 72.2 /100 | #151 | Good 6.5% |
| Yuman | 72.1 /100 | #152 | Good 6.5% |
| Immigrants | Armenia | 71.2 /100 | #153 | Good 6.5% |
| Central American Indians | 71.1 /100 | #154 | Good 6.5% |
| Iroquois | 70.4 /100 | #155 | Good 6.5% |
| Iranians | 69.9 /100 | #156 | Good 6.5% |