Immigrants from Ecuador vs Immigrants from Grenada 4 or more Vehicles in Household
COMPARE
Immigrants from Ecuador
Immigrants from Grenada
4 or more Vehicles in Household
4 or more Vehicles in Household Comparison
Immigrants from Ecuador
Immigrants from Grenada
4.2%
4 OR MORE VEHICLES IN HOUSEHOLD
0.0/ 100
METRIC RATING
330th/ 347
METRIC RANK
2.7%
4 OR MORE VEHICLES IN HOUSEHOLD
0.0/ 100
METRIC RATING
347th/ 347
METRIC RANK
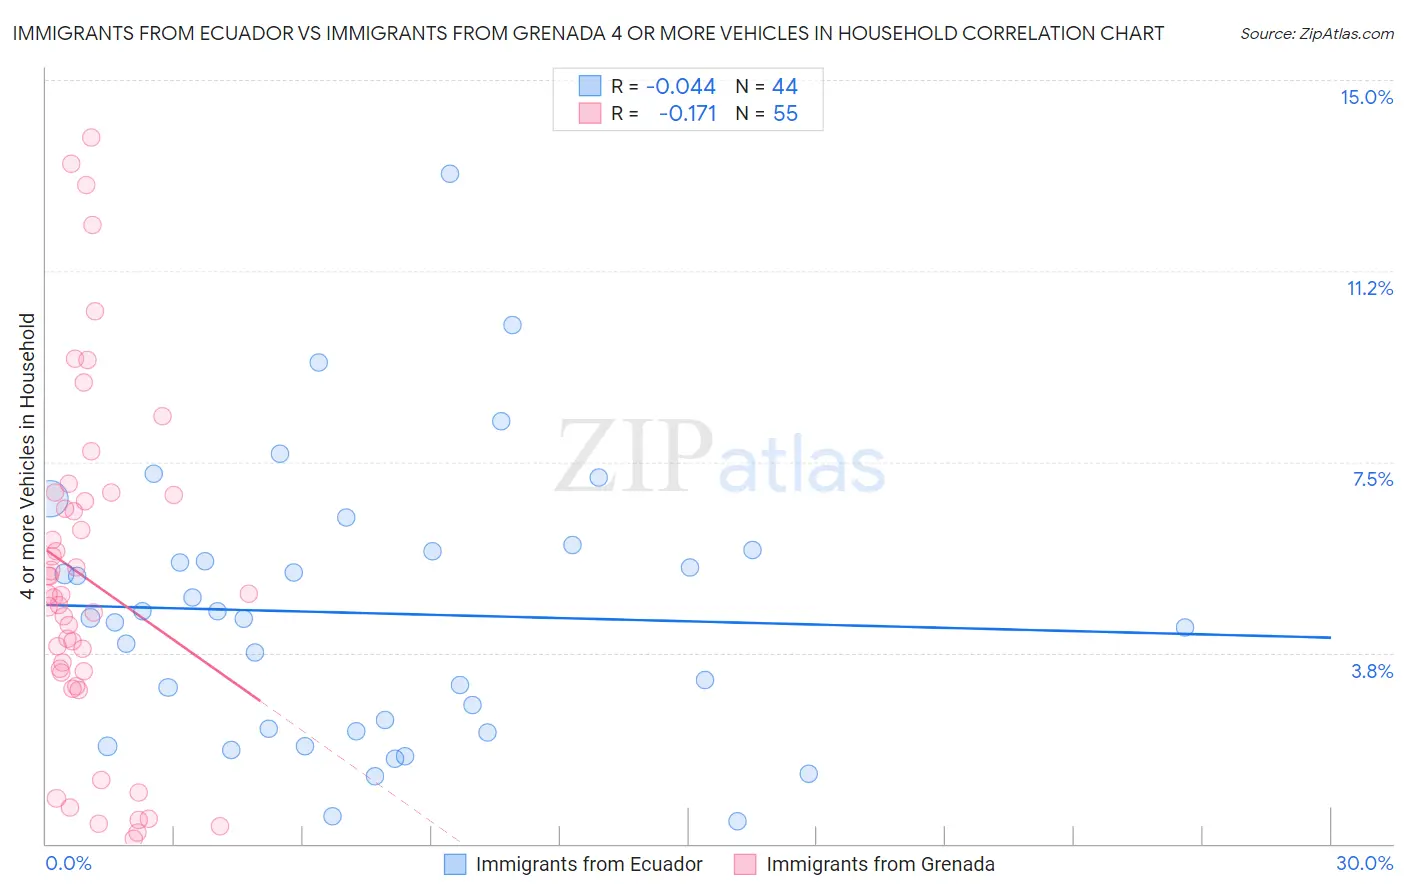
Immigrants from Ecuador vs Immigrants from Grenada 4 or more Vehicles in Household Correlation Chart
The statistical analysis conducted on geographies consisting of 269,639,406 people shows no correlation between the proportion of Immigrants from Ecuador and percentage of households with 4 or more vehicles available in the United States with a correlation coefficient (R) of -0.044 and weighted average of 4.2%. Similarly, the statistical analysis conducted on geographies consisting of 66,738,845 people shows a poor negative correlation between the proportion of Immigrants from Grenada and percentage of households with 4 or more vehicles available in the United States with a correlation coefficient (R) of -0.171 and weighted average of 2.7%, a difference of 54.8%.
4 or more Vehicles in Household Correlation Summary
| Measurement | Immigrants from Ecuador | Immigrants from Grenada |
| Minimum | 0.44% | 0.11% |
| Maximum | 13.2% | 13.9% |
| Range | 12.7% | 13.8% |
| Mean | 4.5% | 5.2% |
| Median | 4.4% | 4.9% |
| Interquartile 25% (IQ1) | 2.2% | 3.4% |
| Interquartile 75% (IQ3) | 5.8% | 6.9% |
| Interquartile Range (IQR) | 3.5% | 3.5% |
| Standard Deviation (Sample) | 2.7% | 3.4% |
| Standard Deviation (Population) | 2.6% | 3.3% |
Demographics Similar to Immigrants from Ecuador and Immigrants from Grenada by 4 or more Vehicles in Household
In terms of 4 or more vehicles in household, the demographic groups most similar to Immigrants from Ecuador are Immigrants from Senegal (4.2%, a difference of 0.20%), West Indian (4.2%, a difference of 0.26%), Trinidadian and Tobagonian (4.3%, a difference of 0.47%), Immigrants from Dominica (4.2%, a difference of 1.2%), and Immigrants from Albania (4.1%, a difference of 2.9%). Similarly, the demographic groups most similar to Immigrants from Grenada are Immigrants from St. Vincent and the Grenadines (3.0%, a difference of 8.5%), Immigrants from Dominican Republic (3.3%, a difference of 19.4%), Immigrants from Guyana (3.4%, a difference of 24.2%), British West Indian (3.5%, a difference of 26.2%), and Guyanese (3.5%, a difference of 27.4%).
| Demographics | Rating | Rank | 4 or more Vehicles in Household |
| Trinidadians and Tobagonians | 0.0 /100 | #328 | Tragic 4.3% |
| Immigrants | Senegal | 0.0 /100 | #329 | Tragic 4.2% |
| Immigrants | Ecuador | 0.0 /100 | #330 | Tragic 4.2% |
| West Indians | 0.0 /100 | #331 | Tragic 4.2% |
| Immigrants | Dominica | 0.0 /100 | #332 | Tragic 4.2% |
| Immigrants | Albania | 0.0 /100 | #333 | Tragic 4.1% |
| Immigrants | Trinidad and Tobago | 0.0 /100 | #334 | Tragic 4.1% |
| Barbadians | 0.0 /100 | #335 | Tragic 3.9% |
| Immigrants | Bangladesh | 0.0 /100 | #336 | Tragic 3.9% |
| Vietnamese | 0.0 /100 | #337 | Tragic 3.9% |
| Immigrants | Cabo Verde | 0.0 /100 | #338 | Tragic 3.8% |
| Immigrants | Uzbekistan | 0.0 /100 | #339 | Tragic 3.6% |
| Immigrants | Barbados | 0.0 /100 | #340 | Tragic 3.6% |
| Dominicans | 0.0 /100 | #341 | Tragic 3.5% |
| Guyanese | 0.0 /100 | #342 | Tragic 3.5% |
| British West Indians | 0.0 /100 | #343 | Tragic 3.5% |
| Immigrants | Guyana | 0.0 /100 | #344 | Tragic 3.4% |
| Immigrants | Dominican Republic | 0.0 /100 | #345 | Tragic 3.3% |
| Immigrants | St. Vincent and the Grenadines | 0.0 /100 | #346 | Tragic 3.0% |
| Immigrants | Grenada | 0.0 /100 | #347 | Tragic 2.7% |