Immigrants from Dominican Republic vs Immigrants from Thailand 2 or more Vehicles in Household
COMPARE
Immigrants from Dominican Republic
Immigrants from Thailand
2 or more Vehicles in Household
2 or more Vehicles in Household Comparison
Immigrants from Dominican Republic
Immigrants from Thailand
33.2%
2 OR MORE VEHICLES IN HOUSEHOLD
0.0/ 100
METRIC RATING
345th/ 347
METRIC RANK
56.6%
2 OR MORE VEHICLES IN HOUSEHOLD
90.7/ 100
METRIC RATING
127th/ 347
METRIC RANK
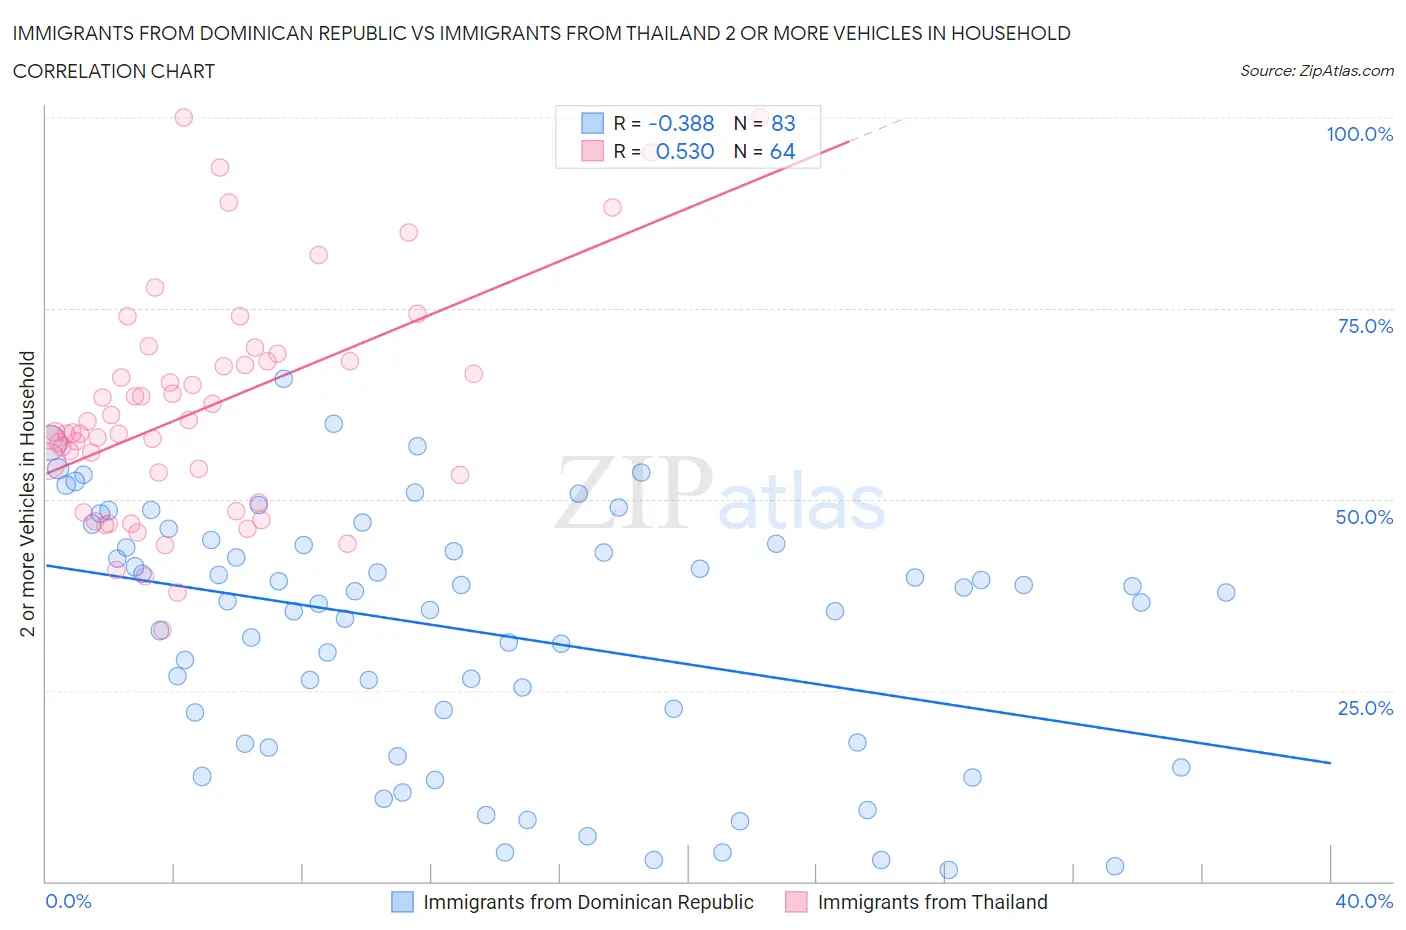
Immigrants from Dominican Republic vs Immigrants from Thailand 2 or more Vehicles in Household Correlation Chart
The statistical analysis conducted on geographies consisting of 274,967,737 people shows a mild negative correlation between the proportion of Immigrants from Dominican Republic and percentage of households with 2 or more vehicles available in the United States with a correlation coefficient (R) of -0.388 and weighted average of 33.2%. Similarly, the statistical analysis conducted on geographies consisting of 316,937,920 people shows a substantial positive correlation between the proportion of Immigrants from Thailand and percentage of households with 2 or more vehicles available in the United States with a correlation coefficient (R) of 0.530 and weighted average of 56.6%, a difference of 70.3%.
2 or more Vehicles in Household Correlation Summary
| Measurement | Immigrants from Dominican Republic | Immigrants from Thailand |
| Minimum | 1.5% | 32.8% |
| Maximum | 65.8% | 100.0% |
| Range | 64.3% | 67.2% |
| Mean | 32.9% | 61.8% |
| Median | 36.6% | 58.7% |
| Interquartile 25% (IQ1) | 18.1% | 51.4% |
| Interquartile 75% (IQ3) | 44.2% | 68.1% |
| Interquartile Range (IQR) | 26.1% | 16.7% |
| Standard Deviation (Sample) | 16.2% | 14.9% |
| Standard Deviation (Population) | 16.1% | 14.8% |
Similar Demographics by 2 or more Vehicles in Household
Demographics Similar to Immigrants from Dominican Republic by 2 or more Vehicles in Household
In terms of 2 or more vehicles in household, the demographic groups most similar to Immigrants from Dominican Republic are Yup'ik (34.9%, a difference of 5.2%), Immigrants from Guyana (35.0%, a difference of 5.3%), Dominican (35.3%, a difference of 6.3%), Guyanese (35.4%, a difference of 6.5%), and British West Indian (35.4%, a difference of 6.5%).
| Demographics | Rating | Rank | 2 or more Vehicles in Household |
| Immigrants | Ecuador | 0.0 /100 | #333 | Tragic 40.5% |
| Immigrants | Trinidad and Tobago | 0.0 /100 | #334 | Tragic 40.3% |
| Immigrants | Bangladesh | 0.0 /100 | #335 | Tragic 38.8% |
| Vietnamese | 0.0 /100 | #336 | Tragic 38.5% |
| Barbadians | 0.0 /100 | #337 | Tragic 38.3% |
| Immigrants | Uzbekistan | 0.0 /100 | #338 | Tragic 37.9% |
| Immigrants | Barbados | 0.0 /100 | #339 | Tragic 35.8% |
| British West Indians | 0.0 /100 | #340 | Tragic 35.4% |
| Guyanese | 0.0 /100 | #341 | Tragic 35.4% |
| Dominicans | 0.0 /100 | #342 | Tragic 35.3% |
| Immigrants | Guyana | 0.0 /100 | #343 | Tragic 35.0% |
| Yup'ik | 0.0 /100 | #344 | Tragic 34.9% |
| Immigrants | Dominican Republic | 0.0 /100 | #345 | Tragic 33.2% |
| Immigrants | St. Vincent and the Grenadines | 0.0 /100 | #346 | Tragic 31.0% |
| Immigrants | Grenada | 0.0 /100 | #347 | Tragic 28.7% |
Demographics Similar to Immigrants from Thailand by 2 or more Vehicles in Household
In terms of 2 or more vehicles in household, the demographic groups most similar to Immigrants from Thailand are Immigrants from South Central Asia (56.6%, a difference of 0.020%), Estonian (56.6%, a difference of 0.030%), Ute (56.6%, a difference of 0.030%), Yugoslavian (56.6%, a difference of 0.070%), and Bulgarian (56.5%, a difference of 0.10%).
| Demographics | Rating | Rank | 2 or more Vehicles in Household |
| Costa Ricans | 94.7 /100 | #120 | Exceptional 56.9% |
| Sioux | 93.8 /100 | #121 | Exceptional 56.8% |
| Immigrants | South Africa | 92.5 /100 | #122 | Exceptional 56.7% |
| Australians | 91.8 /100 | #123 | Exceptional 56.7% |
| New Zealanders | 91.8 /100 | #124 | Exceptional 56.7% |
| Tsimshian | 91.6 /100 | #125 | Exceptional 56.7% |
| Estonians | 90.9 /100 | #126 | Exceptional 56.6% |
| Immigrants | Thailand | 90.7 /100 | #127 | Exceptional 56.6% |
| Immigrants | South Central Asia | 90.5 /100 | #128 | Exceptional 56.6% |
| Ute | 90.4 /100 | #129 | Exceptional 56.6% |
| Yugoslavians | 90.0 /100 | #130 | Exceptional 56.6% |
| Bulgarians | 89.7 /100 | #131 | Excellent 56.5% |
| Hungarians | 89.1 /100 | #132 | Excellent 56.5% |
| Comanche | 88.4 /100 | #133 | Excellent 56.5% |
| Immigrants | Azores | 86.6 /100 | #134 | Excellent 56.4% |