Immigrants from Dominican Republic vs Immigrants from Africa 2 or more Vehicles in Household
COMPARE
Immigrants from Dominican Republic
Immigrants from Africa
2 or more Vehicles in Household
2 or more Vehicles in Household Comparison
Immigrants from Dominican Republic
Immigrants from Africa
33.2%
2 OR MORE VEHICLES IN HOUSEHOLD
0.0/ 100
METRIC RATING
345th/ 347
METRIC RANK
51.8%
2 OR MORE VEHICLES IN HOUSEHOLD
0.2/ 100
METRIC RATING
277th/ 347
METRIC RANK
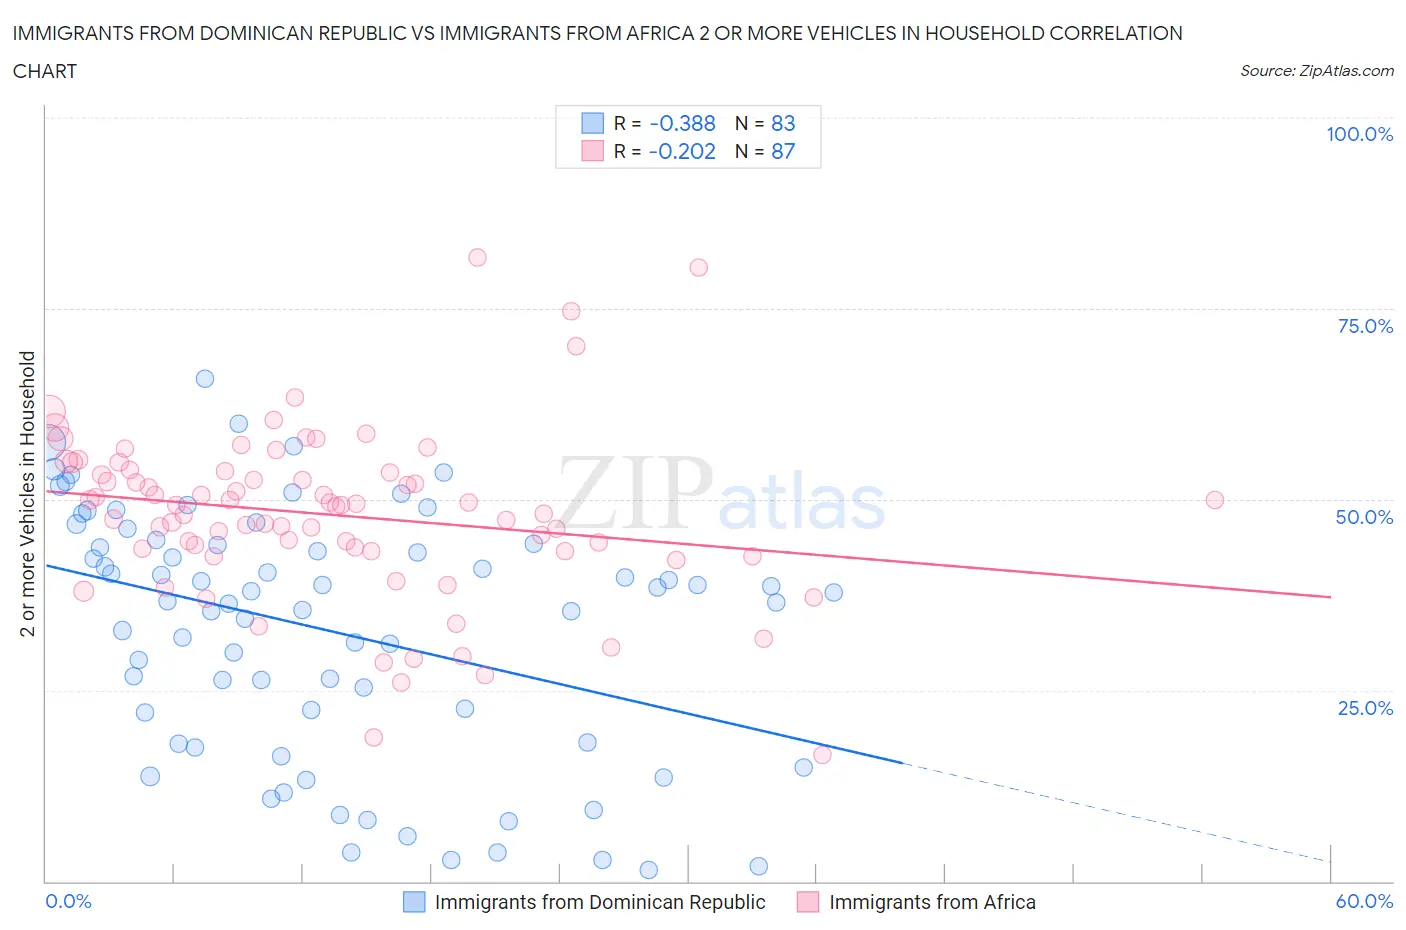
Immigrants from Dominican Republic vs Immigrants from Africa 2 or more Vehicles in Household Correlation Chart
The statistical analysis conducted on geographies consisting of 274,967,737 people shows a mild negative correlation between the proportion of Immigrants from Dominican Republic and percentage of households with 2 or more vehicles available in the United States with a correlation coefficient (R) of -0.388 and weighted average of 33.2%. Similarly, the statistical analysis conducted on geographies consisting of 468,994,559 people shows a weak negative correlation between the proportion of Immigrants from Africa and percentage of households with 2 or more vehicles available in the United States with a correlation coefficient (R) of -0.202 and weighted average of 51.8%, a difference of 55.8%.
2 or more Vehicles in Household Correlation Summary
| Measurement | Immigrants from Dominican Republic | Immigrants from Africa |
| Minimum | 1.5% | 16.4% |
| Maximum | 65.8% | 81.7% |
| Range | 64.3% | 65.2% |
| Mean | 32.9% | 48.0% |
| Median | 36.6% | 49.2% |
| Interquartile 25% (IQ1) | 18.1% | 43.2% |
| Interquartile 75% (IQ3) | 44.2% | 53.7% |
| Interquartile Range (IQR) | 26.1% | 10.5% |
| Standard Deviation (Sample) | 16.2% | 11.3% |
| Standard Deviation (Population) | 16.1% | 11.2% |
Similar Demographics by 2 or more Vehicles in Household
Demographics Similar to Immigrants from Dominican Republic by 2 or more Vehicles in Household
In terms of 2 or more vehicles in household, the demographic groups most similar to Immigrants from Dominican Republic are Yup'ik (34.9%, a difference of 5.2%), Immigrants from Guyana (35.0%, a difference of 5.3%), Dominican (35.3%, a difference of 6.3%), Guyanese (35.4%, a difference of 6.5%), and British West Indian (35.4%, a difference of 6.5%).
| Demographics | Rating | Rank | 2 or more Vehicles in Household |
| Immigrants | Ecuador | 0.0 /100 | #333 | Tragic 40.5% |
| Immigrants | Trinidad and Tobago | 0.0 /100 | #334 | Tragic 40.3% |
| Immigrants | Bangladesh | 0.0 /100 | #335 | Tragic 38.8% |
| Vietnamese | 0.0 /100 | #336 | Tragic 38.5% |
| Barbadians | 0.0 /100 | #337 | Tragic 38.3% |
| Immigrants | Uzbekistan | 0.0 /100 | #338 | Tragic 37.9% |
| Immigrants | Barbados | 0.0 /100 | #339 | Tragic 35.8% |
| British West Indians | 0.0 /100 | #340 | Tragic 35.4% |
| Guyanese | 0.0 /100 | #341 | Tragic 35.4% |
| Dominicans | 0.0 /100 | #342 | Tragic 35.3% |
| Immigrants | Guyana | 0.0 /100 | #343 | Tragic 35.0% |
| Yup'ik | 0.0 /100 | #344 | Tragic 34.9% |
| Immigrants | Dominican Republic | 0.0 /100 | #345 | Tragic 33.2% |
| Immigrants | St. Vincent and the Grenadines | 0.0 /100 | #346 | Tragic 31.0% |
| Immigrants | Grenada | 0.0 /100 | #347 | Tragic 28.7% |
Demographics Similar to Immigrants from Africa by 2 or more Vehicles in Household
In terms of 2 or more vehicles in household, the demographic groups most similar to Immigrants from Africa are Immigrants from Croatia (51.8%, a difference of 0.050%), Yuman (51.7%, a difference of 0.060%), Liberian (51.7%, a difference of 0.070%), Immigrants from Honduras (51.8%, a difference of 0.080%), and African (51.8%, a difference of 0.090%).
| Demographics | Rating | Rank | 2 or more Vehicles in Household |
| Immigrants | Ireland | 0.2 /100 | #270 | Tragic 52.0% |
| South Americans | 0.2 /100 | #271 | Tragic 51.9% |
| Sub-Saharan Africans | 0.2 /100 | #272 | Tragic 51.9% |
| Israelis | 0.2 /100 | #273 | Tragic 51.9% |
| Africans | 0.2 /100 | #274 | Tragic 51.8% |
| Immigrants | Honduras | 0.2 /100 | #275 | Tragic 51.8% |
| Immigrants | Croatia | 0.2 /100 | #276 | Tragic 51.8% |
| Immigrants | Africa | 0.2 /100 | #277 | Tragic 51.8% |
| Yuman | 0.1 /100 | #278 | Tragic 51.7% |
| Liberians | 0.1 /100 | #279 | Tragic 51.7% |
| Immigrants | Eastern Europe | 0.1 /100 | #280 | Tragic 51.7% |
| Immigrants | Kazakhstan | 0.1 /100 | #281 | Tragic 51.6% |
| Bahamians | 0.1 /100 | #282 | Tragic 51.5% |
| Immigrants | China | 0.1 /100 | #283 | Tragic 51.5% |
| Immigrants | Zaire | 0.1 /100 | #284 | Tragic 51.5% |