Immigrants from Denmark vs Immigrants from Western Asia 2 or more Vehicles in Household
COMPARE
Immigrants from Denmark
Immigrants from Western Asia
2 or more Vehicles in Household
2 or more Vehicles in Household Comparison
Immigrants from Denmark
Immigrants from Western Asia
55.3%
2 OR MORE VEHICLES IN HOUSEHOLD
49.4/ 100
METRIC RATING
175th/ 347
METRIC RANK
54.1%
2 OR MORE VEHICLES IN HOUSEHOLD
9.3/ 100
METRIC RATING
216th/ 347
METRIC RANK
Immigrants from Denmark vs Immigrants from Western Asia 2 or more Vehicles in Household Correlation Chart
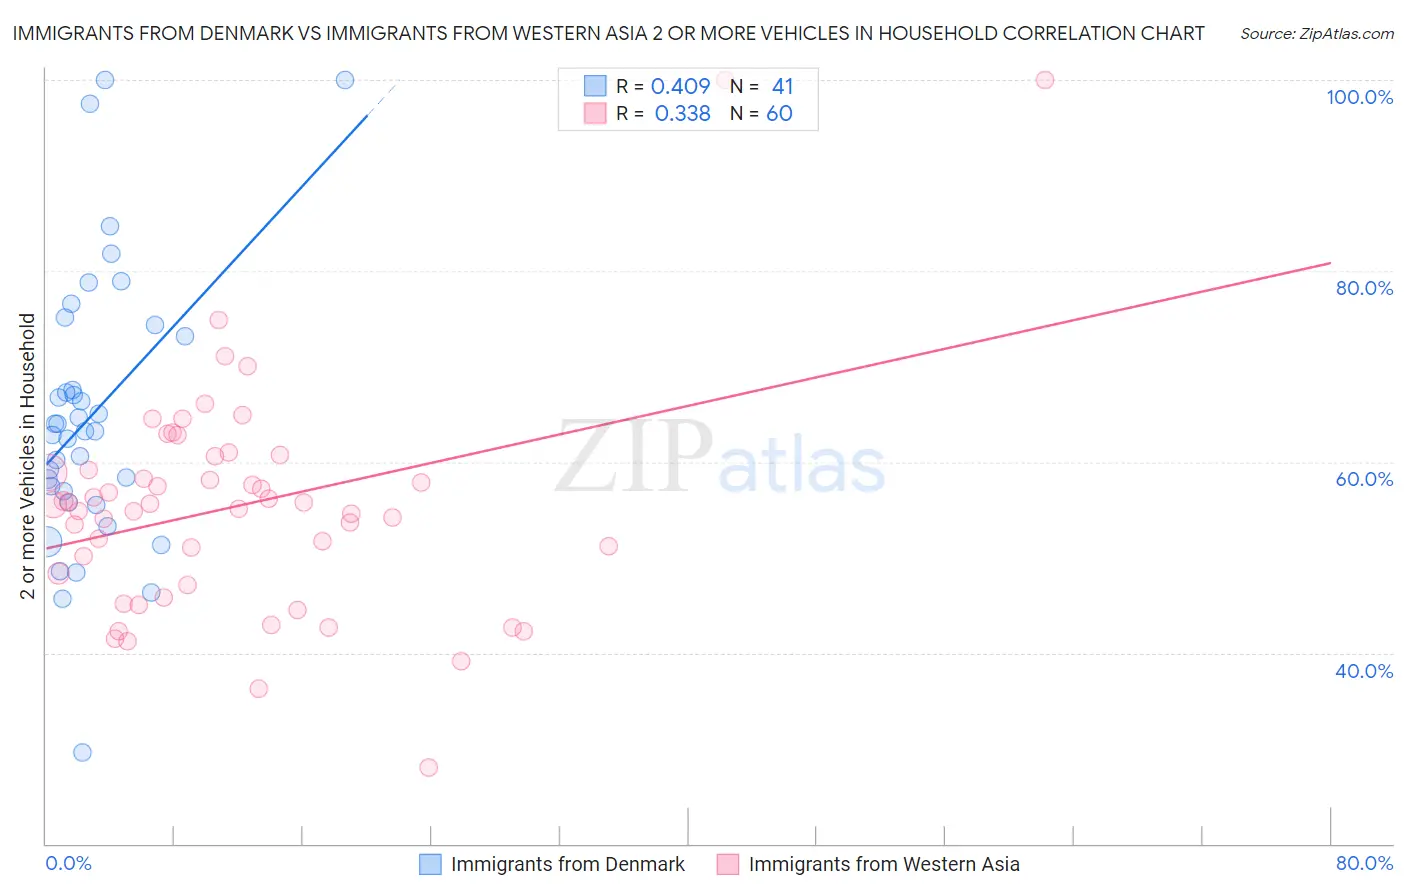
The statistical analysis conducted on geographies consisting of 136,403,254 people shows a moderate positive correlation between the proportion of Immigrants from Denmark and percentage of households with 2 or more vehicles available in the United States with a correlation coefficient (R) of 0.409 and weighted average of 55.3%. Similarly, the statistical analysis conducted on geographies consisting of 404,211,339 people shows a mild positive correlation between the proportion of Immigrants from Western Asia and percentage of households with 2 or more vehicles available in the United States with a correlation coefficient (R) of 0.338 and weighted average of 54.1%, a difference of 2.3%.
2 or more Vehicles in Household Correlation Summary
| Measurement | Immigrants from Denmark | Immigrants from Western Asia |
| Minimum | 29.6% | 28.0% |
| Maximum | 100.0% | 100.0% |
| Range | 70.4% | 72.0% |
| Mean | 64.9% | 55.4% |
| Median | 63.2% | 55.6% |
| Interquartile 25% (IQ1) | 56.3% | 47.7% |
| Interquartile 75% (IQ3) | 73.8% | 59.9% |
| Interquartile Range (IQR) | 17.5% | 12.2% |
| Standard Deviation (Sample) | 14.6% | 12.2% |
| Standard Deviation (Population) | 14.4% | 12.1% |
Similar Demographics by 2 or more Vehicles in Household
Demographics Similar to Immigrants from Denmark by 2 or more Vehicles in Household
In terms of 2 or more vehicles in household, the demographic groups most similar to Immigrants from Denmark are Navajo (55.3%, a difference of 0.020%), Immigrants from Western Europe (55.4%, a difference of 0.080%), Immigrants from Nicaragua (55.4%, a difference of 0.090%), Immigrants from Cuba (55.3%, a difference of 0.090%), and Menominee (55.3%, a difference of 0.13%).
| Demographics | Rating | Rank | 2 or more Vehicles in Household |
| French American Indians | 56.7 /100 | #168 | Average 55.5% |
| Immigrants | Austria | 56.3 /100 | #169 | Average 55.5% |
| Romanians | 55.8 /100 | #170 | Average 55.5% |
| Immigrants | Costa Rica | 54.4 /100 | #171 | Average 55.4% |
| Immigrants | Nicaragua | 51.6 /100 | #172 | Average 55.4% |
| Immigrants | Western Europe | 51.4 /100 | #173 | Average 55.4% |
| Navajo | 50.0 /100 | #174 | Average 55.3% |
| Immigrants | Denmark | 49.4 /100 | #175 | Average 55.3% |
| Immigrants | Cuba | 47.0 /100 | #176 | Average 55.3% |
| Menominee | 46.2 /100 | #177 | Average 55.3% |
| Immigrants | Sweden | 45.3 /100 | #178 | Average 55.2% |
| Alaskan Athabascans | 42.9 /100 | #179 | Average 55.2% |
| Immigrants | Kenya | 40.4 /100 | #180 | Average 55.1% |
| Immigrants | Micronesia | 38.2 /100 | #181 | Fair 55.1% |
| Cree | 38.2 /100 | #182 | Fair 55.1% |
Demographics Similar to Immigrants from Western Asia by 2 or more Vehicles in Household
In terms of 2 or more vehicles in household, the demographic groups most similar to Immigrants from Western Asia are Aleut (54.1%, a difference of 0.0%), Immigrants from Czechoslovakia (54.1%, a difference of 0.020%), Guatemalan (54.1%, a difference of 0.040%), Immigrants from Chile (54.2%, a difference of 0.20%), and Immigrants from Hungary (54.2%, a difference of 0.22%).
| Demographics | Rating | Rank | 2 or more Vehicles in Household |
| Immigrants | Bulgaria | 12.0 /100 | #209 | Poor 54.3% |
| Immigrants | Saudi Arabia | 11.3 /100 | #210 | Poor 54.2% |
| Immigrants | Hungary | 11.3 /100 | #211 | Poor 54.2% |
| Immigrants | Chile | 11.1 /100 | #212 | Poor 54.2% |
| Guatemalans | 9.6 /100 | #213 | Tragic 54.1% |
| Immigrants | Czechoslovakia | 9.4 /100 | #214 | Tragic 54.1% |
| Aleuts | 9.3 /100 | #215 | Tragic 54.1% |
| Immigrants | Western Asia | 9.3 /100 | #216 | Tragic 54.1% |
| Immigrants | Burma/Myanmar | 7.1 /100 | #217 | Tragic 53.9% |
| Immigrants | Argentina | 6.8 /100 | #218 | Tragic 53.9% |
| South American Indians | 6.5 /100 | #219 | Tragic 53.9% |
| Taiwanese | 6.3 /100 | #220 | Tragic 53.9% |
| Immigrants | Singapore | 6.3 /100 | #221 | Tragic 53.9% |
| Kiowa | 6.2 /100 | #222 | Tragic 53.9% |
| Immigrants | Bosnia and Herzegovina | 5.5 /100 | #223 | Tragic 53.8% |