Immigrants from Denmark vs Tongan 2 or more Vehicles in Household
COMPARE
Immigrants from Denmark
Tongan
2 or more Vehicles in Household
2 or more Vehicles in Household Comparison
Immigrants from Denmark
Tongans
55.3%
2 OR MORE VEHICLES IN HOUSEHOLD
49.4/ 100
METRIC RATING
175th/ 347
METRIC RANK
63.5%
2 OR MORE VEHICLES IN HOUSEHOLD
100.0/ 100
METRIC RATING
2nd/ 347
METRIC RANK
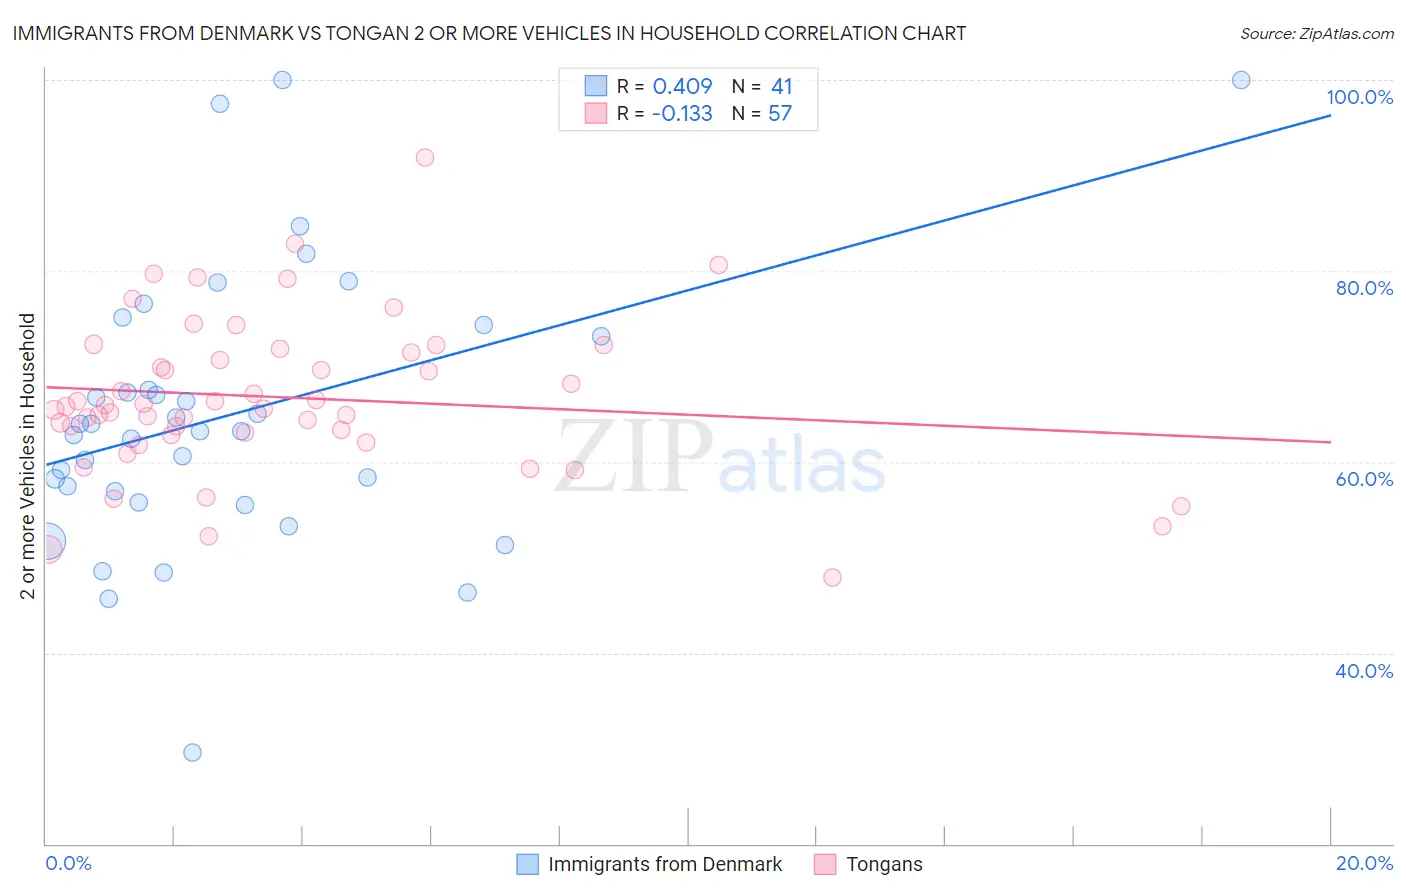
Immigrants from Denmark vs Tongan 2 or more Vehicles in Household Correlation Chart
The statistical analysis conducted on geographies consisting of 136,403,254 people shows a moderate positive correlation between the proportion of Immigrants from Denmark and percentage of households with 2 or more vehicles available in the United States with a correlation coefficient (R) of 0.409 and weighted average of 55.3%. Similarly, the statistical analysis conducted on geographies consisting of 102,873,160 people shows a poor negative correlation between the proportion of Tongans and percentage of households with 2 or more vehicles available in the United States with a correlation coefficient (R) of -0.133 and weighted average of 63.5%, a difference of 14.8%.
2 or more Vehicles in Household Correlation Summary
| Measurement | Immigrants from Denmark | Tongan |
| Minimum | 29.6% | 47.9% |
| Maximum | 100.0% | 91.9% |
| Range | 70.4% | 44.0% |
| Mean | 64.9% | 66.7% |
| Median | 63.2% | 65.8% |
| Interquartile 25% (IQ1) | 56.3% | 63.0% |
| Interquartile 75% (IQ3) | 73.8% | 71.7% |
| Interquartile Range (IQR) | 17.5% | 8.7% |
| Standard Deviation (Sample) | 14.6% | 8.2% |
| Standard Deviation (Population) | 14.4% | 8.1% |
Similar Demographics by 2 or more Vehicles in Household
Demographics Similar to Immigrants from Denmark by 2 or more Vehicles in Household
In terms of 2 or more vehicles in household, the demographic groups most similar to Immigrants from Denmark are Navajo (55.3%, a difference of 0.020%), Immigrants from Western Europe (55.4%, a difference of 0.080%), Immigrants from Nicaragua (55.4%, a difference of 0.090%), Immigrants from Cuba (55.3%, a difference of 0.090%), and Menominee (55.3%, a difference of 0.13%).
| Demographics | Rating | Rank | 2 or more Vehicles in Household |
| French American Indians | 56.7 /100 | #168 | Average 55.5% |
| Immigrants | Austria | 56.3 /100 | #169 | Average 55.5% |
| Romanians | 55.8 /100 | #170 | Average 55.5% |
| Immigrants | Costa Rica | 54.4 /100 | #171 | Average 55.4% |
| Immigrants | Nicaragua | 51.6 /100 | #172 | Average 55.4% |
| Immigrants | Western Europe | 51.4 /100 | #173 | Average 55.4% |
| Navajo | 50.0 /100 | #174 | Average 55.3% |
| Immigrants | Denmark | 49.4 /100 | #175 | Average 55.3% |
| Immigrants | Cuba | 47.0 /100 | #176 | Average 55.3% |
| Menominee | 46.2 /100 | #177 | Average 55.3% |
| Immigrants | Sweden | 45.3 /100 | #178 | Average 55.2% |
| Alaskan Athabascans | 42.9 /100 | #179 | Average 55.2% |
| Immigrants | Kenya | 40.4 /100 | #180 | Average 55.1% |
| Immigrants | Micronesia | 38.2 /100 | #181 | Fair 55.1% |
| Cree | 38.2 /100 | #182 | Fair 55.1% |
Demographics Similar to Tongans by 2 or more Vehicles in Household
In terms of 2 or more vehicles in household, the demographic groups most similar to Tongans are Danish (63.3%, a difference of 0.37%), Norwegian (62.8%, a difference of 1.1%), Immigrants from Fiji (62.3%, a difference of 1.9%), Yakama (64.9%, a difference of 2.2%), and Scandinavian (62.1%, a difference of 2.3%).
| Demographics | Rating | Rank | 2 or more Vehicles in Household |
| Yakama | 100.0 /100 | #1 | Exceptional 64.9% |
| Tongans | 100.0 /100 | #2 | Exceptional 63.5% |
| Danes | 100.0 /100 | #3 | Exceptional 63.3% |
| Norwegians | 100.0 /100 | #4 | Exceptional 62.8% |
| Immigrants | Fiji | 100.0 /100 | #5 | Exceptional 62.3% |
| Scandinavians | 100.0 /100 | #6 | Exceptional 62.1% |
| Puget Sound Salish | 100.0 /100 | #7 | Exceptional 62.1% |
| English | 100.0 /100 | #8 | Exceptional 61.9% |
| Swedes | 100.0 /100 | #9 | Exceptional 61.8% |
| Mexicans | 100.0 /100 | #10 | Exceptional 61.7% |
| Dutch | 100.0 /100 | #11 | Exceptional 61.6% |
| Germans | 100.0 /100 | #12 | Exceptional 61.6% |
| Samoans | 100.0 /100 | #13 | Exceptional 61.5% |
| Czechs | 100.0 /100 | #14 | Exceptional 61.5% |
| Nepalese | 100.0 /100 | #15 | Exceptional 61.4% |