Immigrants from Costa Rica vs Immigrants from West Indies 2 or more Vehicles in Household
COMPARE
Immigrants from Costa Rica
Immigrants from West Indies
2 or more Vehicles in Household
2 or more Vehicles in Household Comparison
Immigrants from Costa Rica
Immigrants from West Indies
55.4%
2 OR MORE VEHICLES IN HOUSEHOLD
54.4/ 100
METRIC RATING
171st/ 347
METRIC RANK
43.1%
2 OR MORE VEHICLES IN HOUSEHOLD
0.0/ 100
METRIC RATING
325th/ 347
METRIC RANK
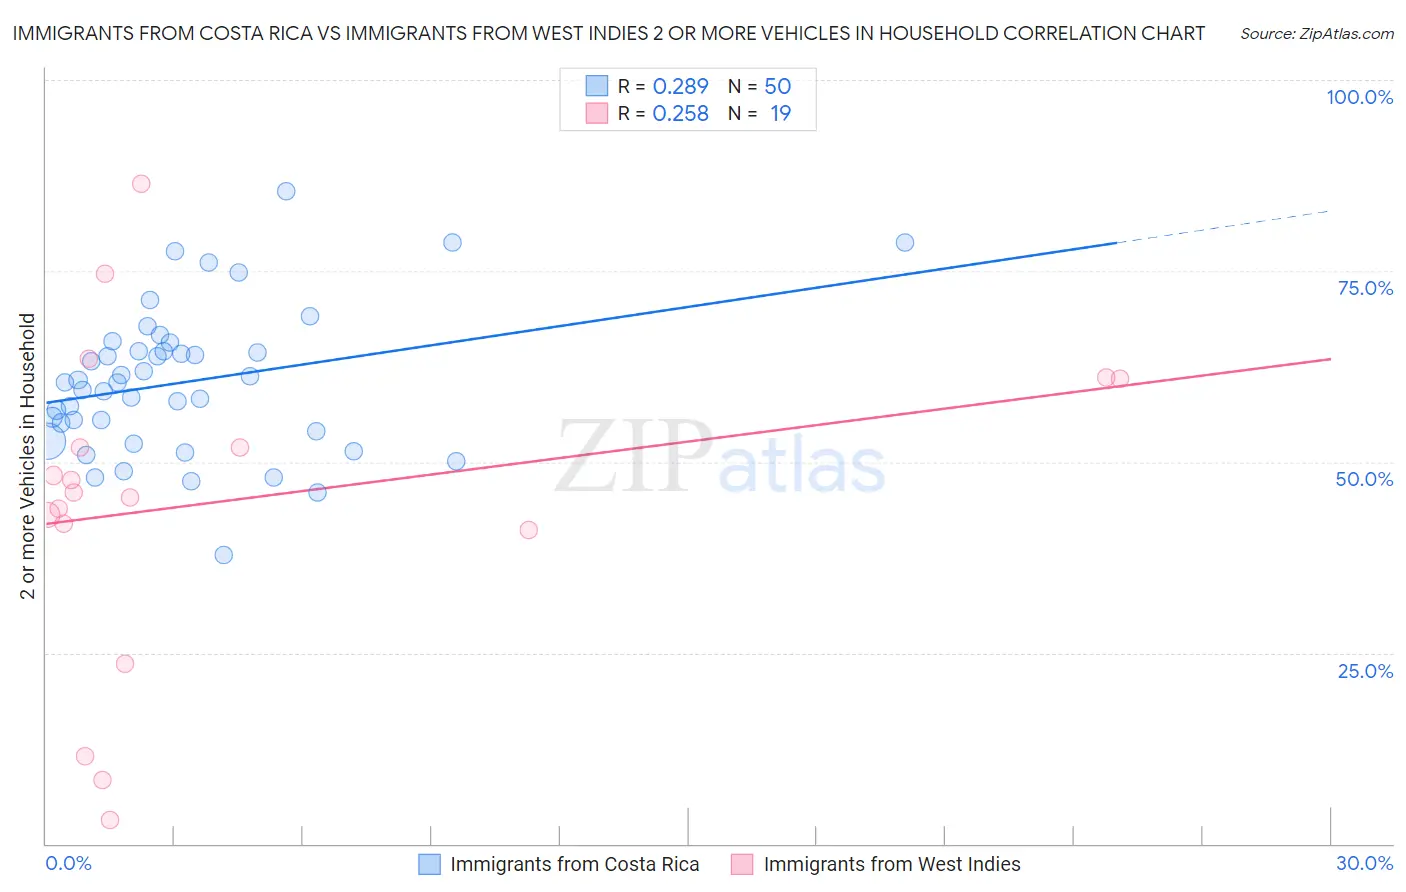
Immigrants from Costa Rica vs Immigrants from West Indies 2 or more Vehicles in Household Correlation Chart
The statistical analysis conducted on geographies consisting of 204,253,183 people shows a weak positive correlation between the proportion of Immigrants from Costa Rica and percentage of households with 2 or more vehicles available in the United States with a correlation coefficient (R) of 0.289 and weighted average of 55.4%. Similarly, the statistical analysis conducted on geographies consisting of 72,454,628 people shows a weak positive correlation between the proportion of Immigrants from West Indies and percentage of households with 2 or more vehicles available in the United States with a correlation coefficient (R) of 0.258 and weighted average of 43.1%, a difference of 28.7%.
2 or more Vehicles in Household Correlation Summary
| Measurement | Immigrants from Costa Rica | Immigrants from West Indies |
| Minimum | 37.8% | 3.0% |
| Maximum | 85.4% | 86.4% |
| Range | 47.6% | 83.3% |
| Mean | 60.5% | 44.9% |
| Median | 60.4% | 46.0% |
| Interquartile 25% (IQ1) | 54.1% | 41.1% |
| Interquartile 75% (IQ3) | 64.4% | 61.0% |
| Interquartile Range (IQR) | 10.4% | 19.8% |
| Standard Deviation (Sample) | 9.6% | 21.4% |
| Standard Deviation (Population) | 9.5% | 20.9% |
Similar Demographics by 2 or more Vehicles in Household
Demographics Similar to Immigrants from Costa Rica by 2 or more Vehicles in Household
In terms of 2 or more vehicles in household, the demographic groups most similar to Immigrants from Costa Rica are Romanian (55.5%, a difference of 0.060%), Immigrants from Austria (55.5%, a difference of 0.080%), French American Indian (55.5%, a difference of 0.090%), Immigrants from Nicaragua (55.4%, a difference of 0.11%), and Immigrants from Western Europe (55.4%, a difference of 0.12%).
| Demographics | Rating | Rank | 2 or more Vehicles in Household |
| Dutch West Indians | 59.8 /100 | #164 | Average 55.6% |
| Immigrants | El Salvador | 59.4 /100 | #165 | Average 55.6% |
| Immigrants | Sri Lanka | 58.3 /100 | #166 | Average 55.5% |
| Kenyans | 58.1 /100 | #167 | Average 55.5% |
| French American Indians | 56.7 /100 | #168 | Average 55.5% |
| Immigrants | Austria | 56.3 /100 | #169 | Average 55.5% |
| Romanians | 55.8 /100 | #170 | Average 55.5% |
| Immigrants | Costa Rica | 54.4 /100 | #171 | Average 55.4% |
| Immigrants | Nicaragua | 51.6 /100 | #172 | Average 55.4% |
| Immigrants | Western Europe | 51.4 /100 | #173 | Average 55.4% |
| Navajo | 50.0 /100 | #174 | Average 55.3% |
| Immigrants | Denmark | 49.4 /100 | #175 | Average 55.3% |
| Immigrants | Cuba | 47.0 /100 | #176 | Average 55.3% |
| Menominee | 46.2 /100 | #177 | Average 55.3% |
| Immigrants | Sweden | 45.3 /100 | #178 | Average 55.2% |
Demographics Similar to Immigrants from West Indies by 2 or more Vehicles in Household
In terms of 2 or more vehicles in household, the demographic groups most similar to Immigrants from West Indies are Immigrants from Senegal (43.0%, a difference of 0.15%), Immigrants from Yemen (42.8%, a difference of 0.56%), Immigrants from Cabo Verde (43.3%, a difference of 0.57%), Inupiat (42.6%, a difference of 1.1%), and Immigrants from Caribbean (44.2%, a difference of 2.6%).
| Demographics | Rating | Rank | 2 or more Vehicles in Household |
| Immigrants | Albania | 0.0 /100 | #318 | Tragic 46.0% |
| Jamaicans | 0.0 /100 | #319 | Tragic 45.8% |
| Soviet Union | 0.0 /100 | #320 | Tragic 45.7% |
| Immigrants | Jamaica | 0.0 /100 | #321 | Tragic 44.5% |
| Senegalese | 0.0 /100 | #322 | Tragic 44.2% |
| Immigrants | Caribbean | 0.0 /100 | #323 | Tragic 44.2% |
| Immigrants | Cabo Verde | 0.0 /100 | #324 | Tragic 43.3% |
| Immigrants | West Indies | 0.0 /100 | #325 | Tragic 43.1% |
| Immigrants | Senegal | 0.0 /100 | #326 | Tragic 43.0% |
| Immigrants | Yemen | 0.0 /100 | #327 | Tragic 42.8% |
| Inupiat | 0.0 /100 | #328 | Tragic 42.6% |
| Ecuadorians | 0.0 /100 | #329 | Tragic 42.0% |
| Immigrants | Dominica | 0.0 /100 | #330 | Tragic 41.6% |
| West Indians | 0.0 /100 | #331 | Tragic 41.3% |
| Trinidadians and Tobagonians | 0.0 /100 | #332 | Tragic 40.9% |