Immigrants from Costa Rica vs Immigrants from Hong Kong 3 or more Vehicles in Household
COMPARE
Immigrants from Costa Rica
Immigrants from Hong Kong
3 or more Vehicles in Household
3 or more Vehicles in Household Comparison
Immigrants from Costa Rica
Immigrants from Hong Kong
19.7%
3 OR MORE VEHICLES IN HOUSEHOLD
61.9/ 100
METRIC RATING
165th/ 347
METRIC RANK
19.2%
3 OR MORE VEHICLES IN HOUSEHOLD
28.3/ 100
METRIC RATING
187th/ 347
METRIC RANK
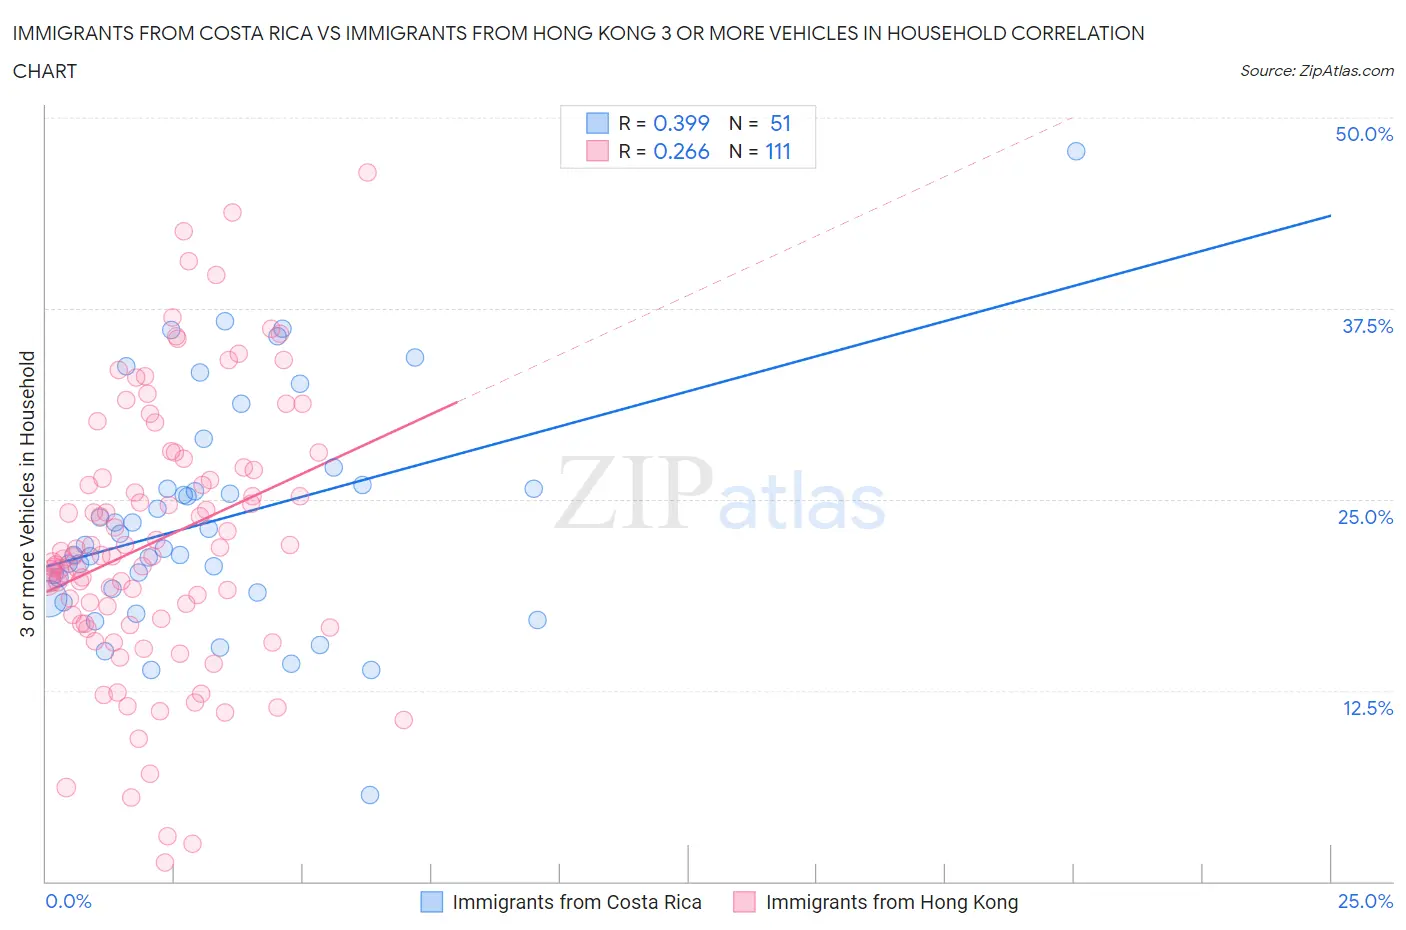
Immigrants from Costa Rica vs Immigrants from Hong Kong 3 or more Vehicles in Household Correlation Chart
The statistical analysis conducted on geographies consisting of 204,232,387 people shows a mild positive correlation between the proportion of Immigrants from Costa Rica and percentage of households with 3 or more vehicles available in the United States with a correlation coefficient (R) of 0.399 and weighted average of 19.7%. Similarly, the statistical analysis conducted on geographies consisting of 253,800,113 people shows a weak positive correlation between the proportion of Immigrants from Hong Kong and percentage of households with 3 or more vehicles available in the United States with a correlation coefficient (R) of 0.266 and weighted average of 19.2%, a difference of 2.7%.
3 or more Vehicles in Household Correlation Summary
| Measurement | Immigrants from Costa Rica | Immigrants from Hong Kong |
| Minimum | 5.6% | 1.2% |
| Maximum | 47.8% | 46.4% |
| Range | 42.2% | 45.2% |
| Mean | 23.6% | 22.3% |
| Median | 22.0% | 21.3% |
| Interquartile 25% (IQ1) | 18.9% | 16.9% |
| Interquartile 75% (IQ3) | 26.0% | 27.1% |
| Interquartile Range (IQR) | 7.0% | 10.2% |
| Standard Deviation (Sample) | 7.6% | 8.8% |
| Standard Deviation (Population) | 7.5% | 8.8% |
Similar Demographics by 3 or more Vehicles in Household
Demographics Similar to Immigrants from Costa Rica by 3 or more Vehicles in Household
In terms of 3 or more vehicles in household, the demographic groups most similar to Immigrants from Costa Rica are Yugoslavian (19.7%, a difference of 0.080%), Immigrants from Cameroon (19.7%, a difference of 0.080%), Chilean (19.7%, a difference of 0.090%), Estonian (19.7%, a difference of 0.11%), and Ukrainian (19.6%, a difference of 0.24%).
| Demographics | Rating | Rank | 3 or more Vehicles in Household |
| Armenians | 68.8 /100 | #158 | Good 19.8% |
| Immigrants | Pakistan | 68.2 /100 | #159 | Good 19.8% |
| Immigrants | Lebanon | 67.6 /100 | #160 | Good 19.8% |
| Immigrants | Guatemala | 65.6 /100 | #161 | Good 19.7% |
| Estonians | 63.2 /100 | #162 | Good 19.7% |
| Chileans | 63.0 /100 | #163 | Good 19.7% |
| Yugoslavians | 62.9 /100 | #164 | Good 19.7% |
| Immigrants | Costa Rica | 61.9 /100 | #165 | Good 19.7% |
| Immigrants | Cameroon | 60.9 /100 | #166 | Good 19.7% |
| Ukrainians | 58.9 /100 | #167 | Average 19.6% |
| Peruvians | 58.8 /100 | #168 | Average 19.6% |
| Immigrants | Denmark | 57.6 /100 | #169 | Average 19.6% |
| Iraqis | 56.0 /100 | #170 | Average 19.6% |
| Immigrants | Western Europe | 53.2 /100 | #171 | Average 19.5% |
| Kiowa | 50.9 /100 | #172 | Average 19.5% |
Demographics Similar to Immigrants from Hong Kong by 3 or more Vehicles in Household
In terms of 3 or more vehicles in household, the demographic groups most similar to Immigrants from Hong Kong are Immigrants from Sweden (19.2%, a difference of 0.060%), Immigrants from Sri Lanka (19.2%, a difference of 0.22%), Immigrants from Kuwait (19.1%, a difference of 0.22%), Indian (Asian) (19.1%, a difference of 0.22%), and Immigrants from Zimbabwe (19.1%, a difference of 0.28%).
| Demographics | Rating | Rank | 3 or more Vehicles in Household |
| South Africans | 37.5 /100 | #180 | Fair 19.3% |
| Romanians | 37.1 /100 | #181 | Fair 19.3% |
| Cubans | 36.6 /100 | #182 | Fair 19.3% |
| Cajuns | 36.0 /100 | #183 | Fair 19.3% |
| Latvians | 35.7 /100 | #184 | Fair 19.3% |
| Immigrants | Sri Lanka | 30.7 /100 | #185 | Fair 19.2% |
| Immigrants | Sweden | 29.0 /100 | #186 | Fair 19.2% |
| Immigrants | Hong Kong | 28.3 /100 | #187 | Fair 19.2% |
| Immigrants | Kuwait | 26.1 /100 | #188 | Fair 19.1% |
| Indians (Asian) | 26.0 /100 | #189 | Fair 19.1% |
| Immigrants | Zimbabwe | 25.5 /100 | #190 | Fair 19.1% |
| South American Indians | 25.4 /100 | #191 | Fair 19.1% |
| Kenyans | 24.7 /100 | #192 | Fair 19.1% |
| Tsimshian | 24.4 /100 | #193 | Fair 19.1% |
| Serbians | 24.0 /100 | #194 | Fair 19.1% |