Immigrants from Congo vs Senegalese 4 or more Vehicles in Household
COMPARE
Immigrants from Congo
Senegalese
4 or more Vehicles in Household
4 or more Vehicles in Household Comparison
Immigrants from Congo
Senegalese
5.2%
4 OR MORE VEHICLES IN HOUSEHOLD
0.1/ 100
METRIC RATING
293rd/ 347
METRIC RANK
4.3%
4 OR MORE VEHICLES IN HOUSEHOLD
0.0/ 100
METRIC RATING
327th/ 347
METRIC RANK
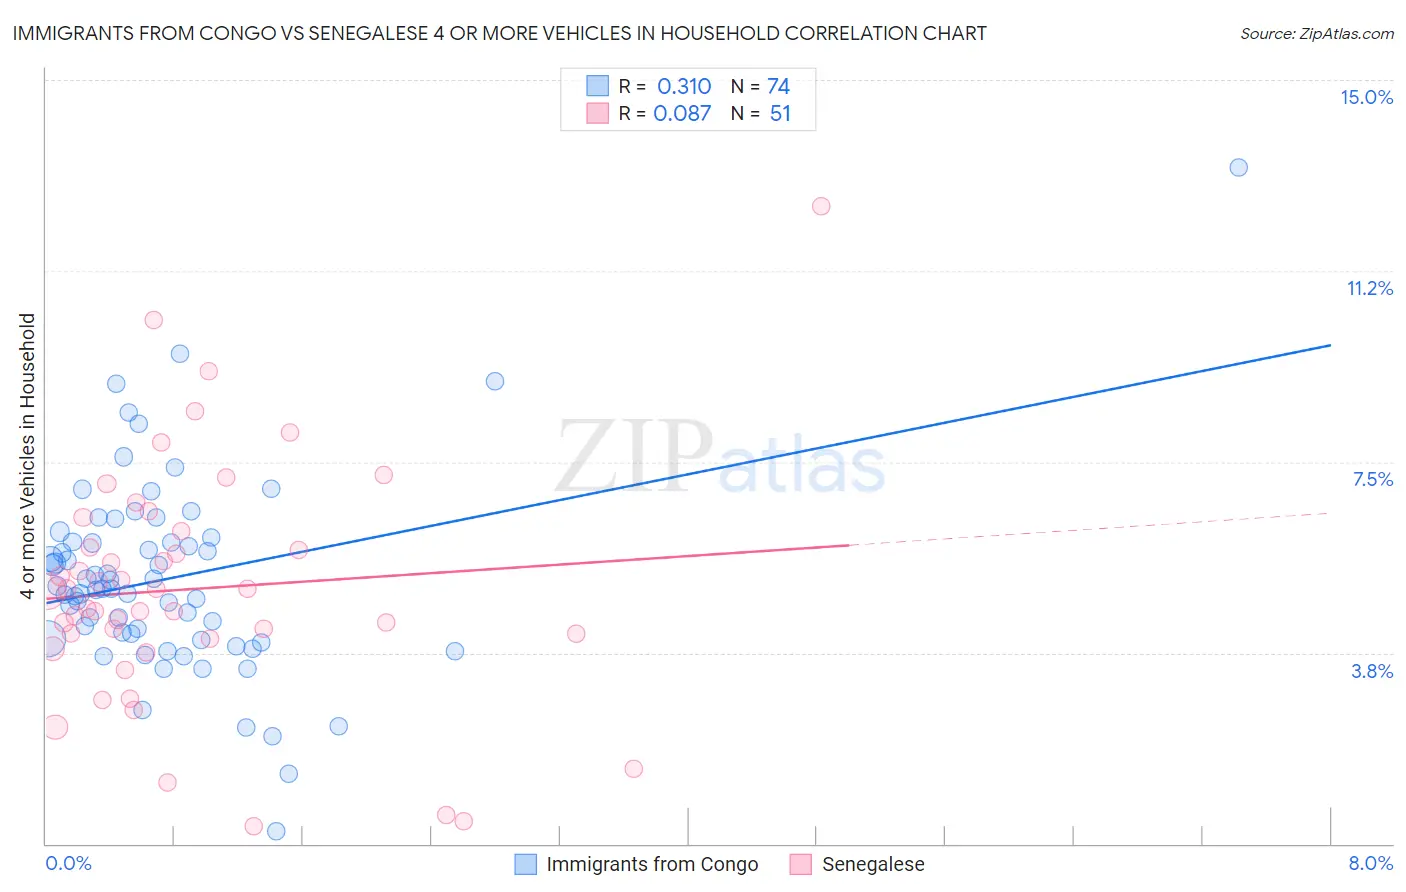
Immigrants from Congo vs Senegalese 4 or more Vehicles in Household Correlation Chart
The statistical analysis conducted on geographies consisting of 92,027,123 people shows a mild positive correlation between the proportion of Immigrants from Congo and percentage of households with 4 or more vehicles available in the United States with a correlation coefficient (R) of 0.310 and weighted average of 5.2%. Similarly, the statistical analysis conducted on geographies consisting of 77,911,640 people shows a slight positive correlation between the proportion of Senegalese and percentage of households with 4 or more vehicles available in the United States with a correlation coefficient (R) of 0.087 and weighted average of 4.3%, a difference of 21.5%.
4 or more Vehicles in Household Correlation Summary
| Measurement | Immigrants from Congo | Senegalese |
| Minimum | 0.25% | 0.34% |
| Maximum | 13.3% | 12.5% |
| Range | 13.0% | 12.2% |
| Mean | 5.2% | 5.0% |
| Median | 5.0% | 5.0% |
| Interquartile 25% (IQ1) | 4.0% | 4.0% |
| Interquartile 75% (IQ3) | 5.9% | 6.1% |
| Interquartile Range (IQR) | 1.9% | 2.1% |
| Standard Deviation (Sample) | 1.9% | 2.4% |
| Standard Deviation (Population) | 1.9% | 2.3% |
Similar Demographics by 4 or more Vehicles in Household
Demographics Similar to Immigrants from Congo by 4 or more Vehicles in Household
In terms of 4 or more vehicles in household, the demographic groups most similar to Immigrants from Congo are Liberian (5.3%, a difference of 0.030%), Ghanaian (5.2%, a difference of 0.050%), Immigrants from Bahamas (5.3%, a difference of 0.13%), Immigrants from Brazil (5.2%, a difference of 0.17%), and Israeli (5.2%, a difference of 0.35%).
| Demographics | Rating | Rank | 4 or more Vehicles in Household |
| Immigrants | Colombia | 0.2 /100 | #286 | Tragic 5.4% |
| Immigrants | Croatia | 0.2 /100 | #287 | Tragic 5.4% |
| Venezuelans | 0.2 /100 | #288 | Tragic 5.3% |
| Immigrants | Bosnia and Herzegovina | 0.2 /100 | #289 | Tragic 5.3% |
| Immigrants | Russia | 0.2 /100 | #290 | Tragic 5.3% |
| Immigrants | Bahamas | 0.1 /100 | #291 | Tragic 5.3% |
| Liberians | 0.1 /100 | #292 | Tragic 5.3% |
| Immigrants | Congo | 0.1 /100 | #293 | Tragic 5.2% |
| Ghanaians | 0.1 /100 | #294 | Tragic 5.2% |
| Immigrants | Brazil | 0.1 /100 | #295 | Tragic 5.2% |
| Israelis | 0.1 /100 | #296 | Tragic 5.2% |
| Immigrants | Venezuela | 0.1 /100 | #297 | Tragic 5.2% |
| Immigrants | South America | 0.1 /100 | #298 | Tragic 5.2% |
| Immigrants | Ghana | 0.1 /100 | #299 | Tragic 5.2% |
| Immigrants | Morocco | 0.0 /100 | #300 | Tragic 5.1% |
Demographics Similar to Senegalese by 4 or more Vehicles in Household
In terms of 4 or more vehicles in household, the demographic groups most similar to Senegalese are Trinidadian and Tobagonian (4.3%, a difference of 1.6%), Cape Verdean (4.4%, a difference of 1.8%), Immigrants from Senegal (4.2%, a difference of 1.9%), Immigrants from Ecuador (4.2%, a difference of 2.1%), and Immigrants from Jamaica (4.4%, a difference of 2.1%).
| Demographics | Rating | Rank | 4 or more Vehicles in Household |
| Immigrants | Haiti | 0.0 /100 | #320 | Tragic 4.5% |
| Ecuadorians | 0.0 /100 | #321 | Tragic 4.5% |
| Immigrants | Yemen | 0.0 /100 | #322 | Tragic 4.5% |
| Immigrants | Caribbean | 0.0 /100 | #323 | Tragic 4.4% |
| Soviet Union | 0.0 /100 | #324 | Tragic 4.4% |
| Immigrants | Jamaica | 0.0 /100 | #325 | Tragic 4.4% |
| Cape Verdeans | 0.0 /100 | #326 | Tragic 4.4% |
| Senegalese | 0.0 /100 | #327 | Tragic 4.3% |
| Trinidadians and Tobagonians | 0.0 /100 | #328 | Tragic 4.3% |
| Immigrants | Senegal | 0.0 /100 | #329 | Tragic 4.2% |
| Immigrants | Ecuador | 0.0 /100 | #330 | Tragic 4.2% |
| West Indians | 0.0 /100 | #331 | Tragic 4.2% |
| Immigrants | Dominica | 0.0 /100 | #332 | Tragic 4.2% |
| Immigrants | Albania | 0.0 /100 | #333 | Tragic 4.1% |
| Immigrants | Trinidad and Tobago | 0.0 /100 | #334 | Tragic 4.1% |