Immigrants from Colombia vs Immigrants from Fiji No Vehicles in Household
COMPARE
Immigrants from Colombia
Immigrants from Fiji
No Vehicles in Household
No Vehicles in Household Comparison
Immigrants from Colombia
Immigrants from Fiji
10.5%
NO VEHICLES IN HOUSEHOLD
44.1/ 100
METRIC RATING
181st/ 347
METRIC RANK
7.8%
NO VEHICLES IN HOUSEHOLD
99.9/ 100
METRIC RATING
39th/ 347
METRIC RANK
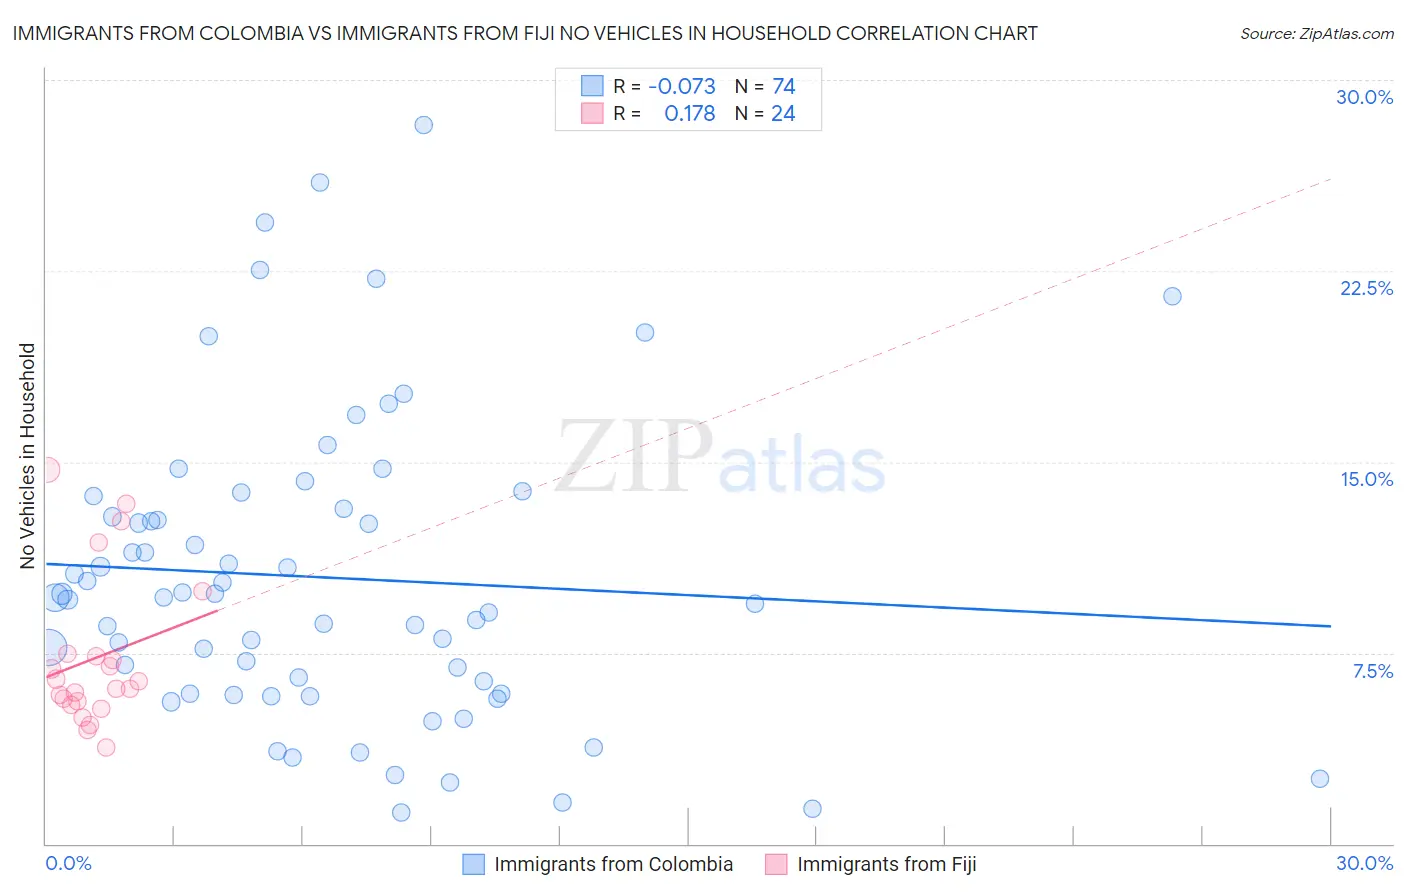
Immigrants from Colombia vs Immigrants from Fiji No Vehicles in Household Correlation Chart
The statistical analysis conducted on geographies consisting of 362,333,216 people shows a slight negative correlation between the proportion of Immigrants from Colombia and percentage of households with no vehicle available in the United States with a correlation coefficient (R) of -0.073 and weighted average of 10.5%. Similarly, the statistical analysis conducted on geographies consisting of 93,723,528 people shows a poor positive correlation between the proportion of Immigrants from Fiji and percentage of households with no vehicle available in the United States with a correlation coefficient (R) of 0.178 and weighted average of 7.8%, a difference of 34.1%.
No Vehicles in Household Correlation Summary
| Measurement | Immigrants from Colombia | Immigrants from Fiji |
| Minimum | 1.2% | 3.8% |
| Maximum | 28.2% | 14.7% |
| Range | 27.0% | 10.9% |
| Mean | 10.5% | 7.3% |
| Median | 9.7% | 6.2% |
| Interquartile 25% (IQ1) | 5.9% | 5.5% |
| Interquartile 75% (IQ3) | 13.1% | 7.4% |
| Interquartile Range (IQR) | 7.2% | 1.9% |
| Standard Deviation (Sample) | 5.9% | 3.0% |
| Standard Deviation (Population) | 5.9% | 2.9% |
Similar Demographics by No Vehicles in Household
Demographics Similar to Immigrants from Colombia by No Vehicles in Household
In terms of no vehicles in household, the demographic groups most similar to Immigrants from Colombia are Immigrants from Bulgaria (10.5%, a difference of 0.040%), Native/Alaskan (10.5%, a difference of 0.060%), Arab (10.5%, a difference of 0.16%), Ethiopian (10.5%, a difference of 0.22%), and Immigrants from Nepal (10.5%, a difference of 0.23%).
| Demographics | Rating | Rank | No Vehicles in Household |
| Immigrants | Sudan | 50.0 /100 | #174 | Average 10.4% |
| Immigrants | Burma/Myanmar | 49.1 /100 | #175 | Average 10.4% |
| French American Indians | 49.1 /100 | #176 | Average 10.4% |
| Immigrants | El Salvador | 49.1 /100 | #177 | Average 10.4% |
| Immigrants | Ethiopia | 48.0 /100 | #178 | Average 10.4% |
| Ethiopians | 45.8 /100 | #179 | Average 10.5% |
| Arabs | 45.3 /100 | #180 | Average 10.5% |
| Immigrants | Colombia | 44.1 /100 | #181 | Average 10.5% |
| Immigrants | Bulgaria | 43.8 /100 | #182 | Average 10.5% |
| Natives/Alaskans | 43.7 /100 | #183 | Average 10.5% |
| Immigrants | Nepal | 42.4 /100 | #184 | Average 10.5% |
| South Americans | 41.9 /100 | #185 | Average 10.5% |
| German Russians | 40.6 /100 | #186 | Average 10.5% |
| Immigrants | Poland | 38.4 /100 | #187 | Fair 10.6% |
| Immigrants | Armenia | 37.5 /100 | #188 | Fair 10.6% |
Demographics Similar to Immigrants from Fiji by No Vehicles in Household
In terms of no vehicles in household, the demographic groups most similar to Immigrants from Fiji are Czechoslovakian (7.8%, a difference of 0.10%), French Canadian (7.8%, a difference of 0.24%), Swiss (7.9%, a difference of 0.38%), Chickasaw (7.9%, a difference of 0.46%), and Creek (7.8%, a difference of 0.58%).
| Demographics | Rating | Rank | No Vehicles in Household |
| Malaysians | 100.0 /100 | #32 | Exceptional 7.7% |
| Immigrants | Taiwan | 100.0 /100 | #33 | Exceptional 7.7% |
| Immigrants | Vietnam | 100.0 /100 | #34 | Exceptional 7.7% |
| Cherokee | 99.9 /100 | #35 | Exceptional 7.7% |
| Iraqis | 99.9 /100 | #36 | Exceptional 7.7% |
| Basques | 99.9 /100 | #37 | Exceptional 7.8% |
| Creek | 99.9 /100 | #38 | Exceptional 7.8% |
| Immigrants | Fiji | 99.9 /100 | #39 | Exceptional 7.8% |
| Czechoslovakians | 99.9 /100 | #40 | Exceptional 7.8% |
| French Canadians | 99.9 /100 | #41 | Exceptional 7.8% |
| Swiss | 99.9 /100 | #42 | Exceptional 7.9% |
| Chickasaw | 99.9 /100 | #43 | Exceptional 7.9% |
| Choctaw | 99.9 /100 | #44 | Exceptional 7.9% |
| Immigrants | Nonimmigrants | 99.9 /100 | #45 | Exceptional 7.9% |
| Spanish | 99.9 /100 | #46 | Exceptional 7.9% |