Immigrants from Colombia vs New Zealander Unemployment
COMPARE
Immigrants from Colombia
New Zealander
Unemployment
Unemployment Comparison
Immigrants from Colombia
New Zealanders
5.2%
UNEMPLOYMENT
64.7/ 100
METRIC RATING
164th/ 347
METRIC RANK
4.9%
UNEMPLOYMENT
98.6/ 100
METRIC RATING
67th/ 347
METRIC RANK
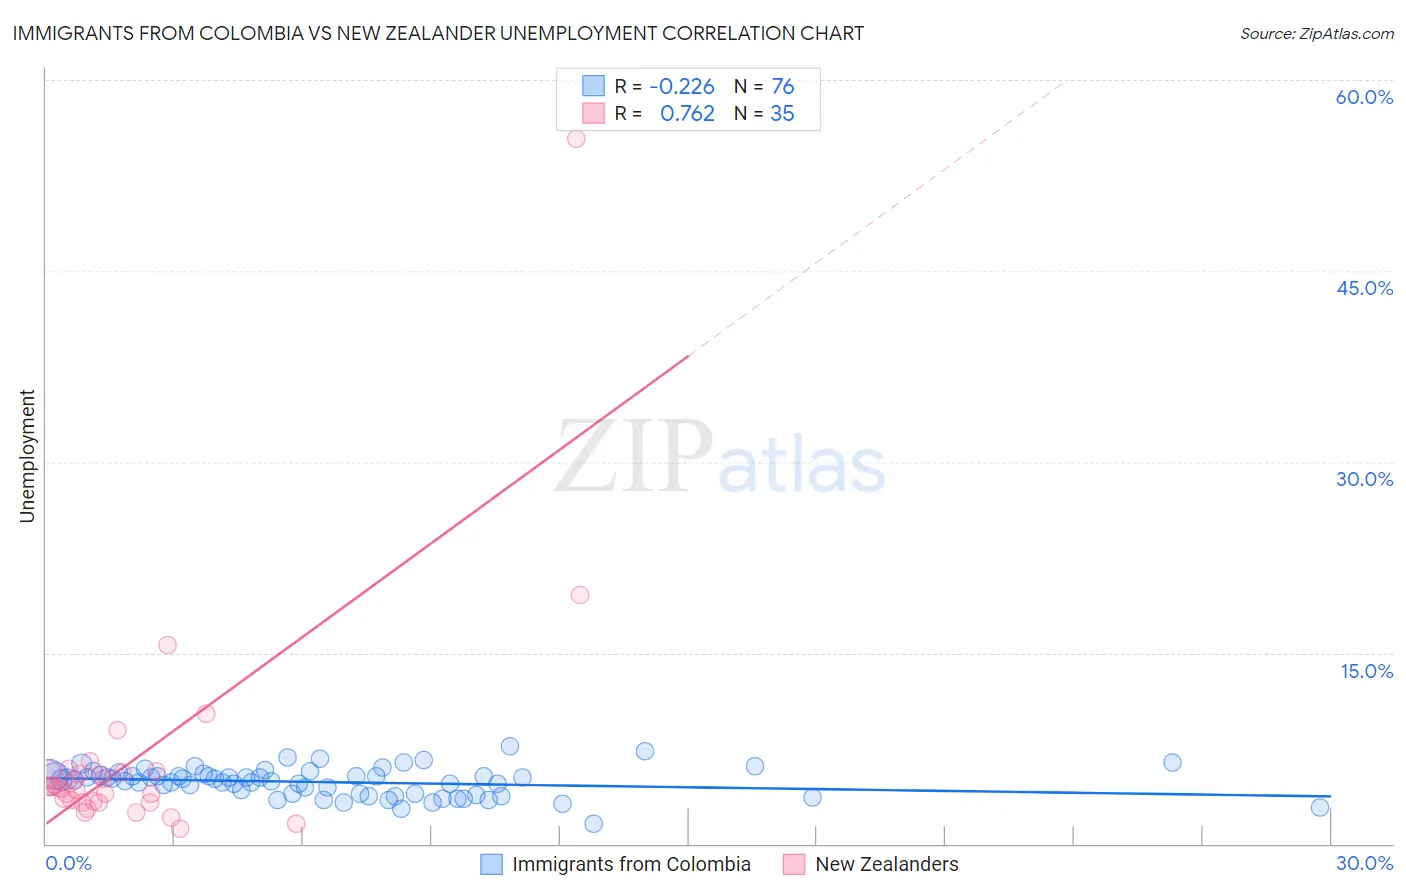
Immigrants from Colombia vs New Zealander Unemployment Correlation Chart
The statistical analysis conducted on geographies consisting of 378,436,728 people shows a weak negative correlation between the proportion of Immigrants from Colombia and unemployment in the United States with a correlation coefficient (R) of -0.226 and weighted average of 5.2%. Similarly, the statistical analysis conducted on geographies consisting of 106,884,587 people shows a strong positive correlation between the proportion of New Zealanders and unemployment in the United States with a correlation coefficient (R) of 0.762 and weighted average of 4.9%, a difference of 6.0%.
Unemployment Correlation Summary
| Measurement | Immigrants from Colombia | New Zealander |
| Minimum | 1.6% | 1.2% |
| Maximum | 7.7% | 55.4% |
| Range | 6.1% | 54.2% |
| Mean | 4.8% | 6.6% |
| Median | 5.0% | 4.4% |
| Interquartile 25% (IQ1) | 3.9% | 3.3% |
| Interquartile 75% (IQ3) | 5.3% | 5.6% |
| Interquartile Range (IQR) | 1.4% | 2.3% |
| Standard Deviation (Sample) | 1.1% | 9.2% |
| Standard Deviation (Population) | 1.1% | 9.1% |
Similar Demographics by Unemployment
Demographics Similar to Immigrants from Colombia by Unemployment
In terms of unemployment, the demographic groups most similar to Immigrants from Colombia are Immigrants from Zaire (5.2%, a difference of 0.0%), Spanish (5.2%, a difference of 0.030%), Immigrants from Oceania (5.2%, a difference of 0.040%), Laotian (5.2%, a difference of 0.11%), and Immigrants from Brazil (5.2%, a difference of 0.11%).
| Demographics | Rating | Rank | Unemployment |
| Sri Lankans | 69.5 /100 | #157 | Good 5.2% |
| Immigrants | Egypt | 66.7 /100 | #158 | Good 5.2% |
| Immigrants | Russia | 66.6 /100 | #159 | Good 5.2% |
| Laotians | 66.3 /100 | #160 | Good 5.2% |
| Immigrants | Oceania | 65.2 /100 | #161 | Good 5.2% |
| Spanish | 65.1 /100 | #162 | Good 5.2% |
| Immigrants | Zaire | 64.7 /100 | #163 | Good 5.2% |
| Immigrants | Colombia | 64.7 /100 | #164 | Good 5.2% |
| Immigrants | Brazil | 63.1 /100 | #165 | Good 5.2% |
| Immigrants | Indonesia | 61.2 /100 | #166 | Good 5.2% |
| Colombians | 61.1 /100 | #167 | Good 5.2% |
| Uruguayans | 60.2 /100 | #168 | Good 5.2% |
| Immigrants | Morocco | 59.1 /100 | #169 | Average 5.2% |
| Immigrants | Nicaragua | 57.1 /100 | #170 | Average 5.2% |
| Puget Sound Salish | 56.6 /100 | #171 | Average 5.2% |
Demographics Similar to New Zealanders by Unemployment
In terms of unemployment, the demographic groups most similar to New Zealanders are Slavic (4.9%, a difference of 0.030%), Slovak (4.9%, a difference of 0.040%), Immigrants from North America (4.9%, a difference of 0.12%), Immigrants from Canada (4.9%, a difference of 0.19%), and Serbian (4.9%, a difference of 0.27%).
| Demographics | Rating | Rank | Unemployment |
| Immigrants | Netherlands | 99.0 /100 | #60 | Exceptional 4.9% |
| Cambodians | 99.0 /100 | #61 | Exceptional 4.9% |
| Icelanders | 98.9 /100 | #62 | Exceptional 4.9% |
| Immigrants | Bulgaria | 98.9 /100 | #63 | Exceptional 4.9% |
| Italians | 98.9 /100 | #64 | Exceptional 4.9% |
| Immigrants | Canada | 98.8 /100 | #65 | Exceptional 4.9% |
| Slovaks | 98.7 /100 | #66 | Exceptional 4.9% |
| New Zealanders | 98.6 /100 | #67 | Exceptional 4.9% |
| Slavs | 98.6 /100 | #68 | Exceptional 4.9% |
| Immigrants | North America | 98.5 /100 | #69 | Exceptional 4.9% |
| Serbians | 98.4 /100 | #70 | Exceptional 4.9% |
| Immigrants | Japan | 98.3 /100 | #71 | Exceptional 4.9% |
| Burmese | 98.3 /100 | #72 | Exceptional 4.9% |
| Paraguayans | 98.3 /100 | #73 | Exceptional 4.9% |
| Immigrants | Northern Europe | 98.2 /100 | #74 | Exceptional 4.9% |