Immigrants from Colombia vs Kenyan 3 or more Vehicles in Household
COMPARE
Immigrants from Colombia
Kenyan
3 or more Vehicles in Household
3 or more Vehicles in Household Comparison
Immigrants from Colombia
Kenyans
17.3%
3 OR MORE VEHICLES IN HOUSEHOLD
0.3/ 100
METRIC RATING
284th/ 347
METRIC RANK
19.1%
3 OR MORE VEHICLES IN HOUSEHOLD
24.7/ 100
METRIC RATING
192nd/ 347
METRIC RANK
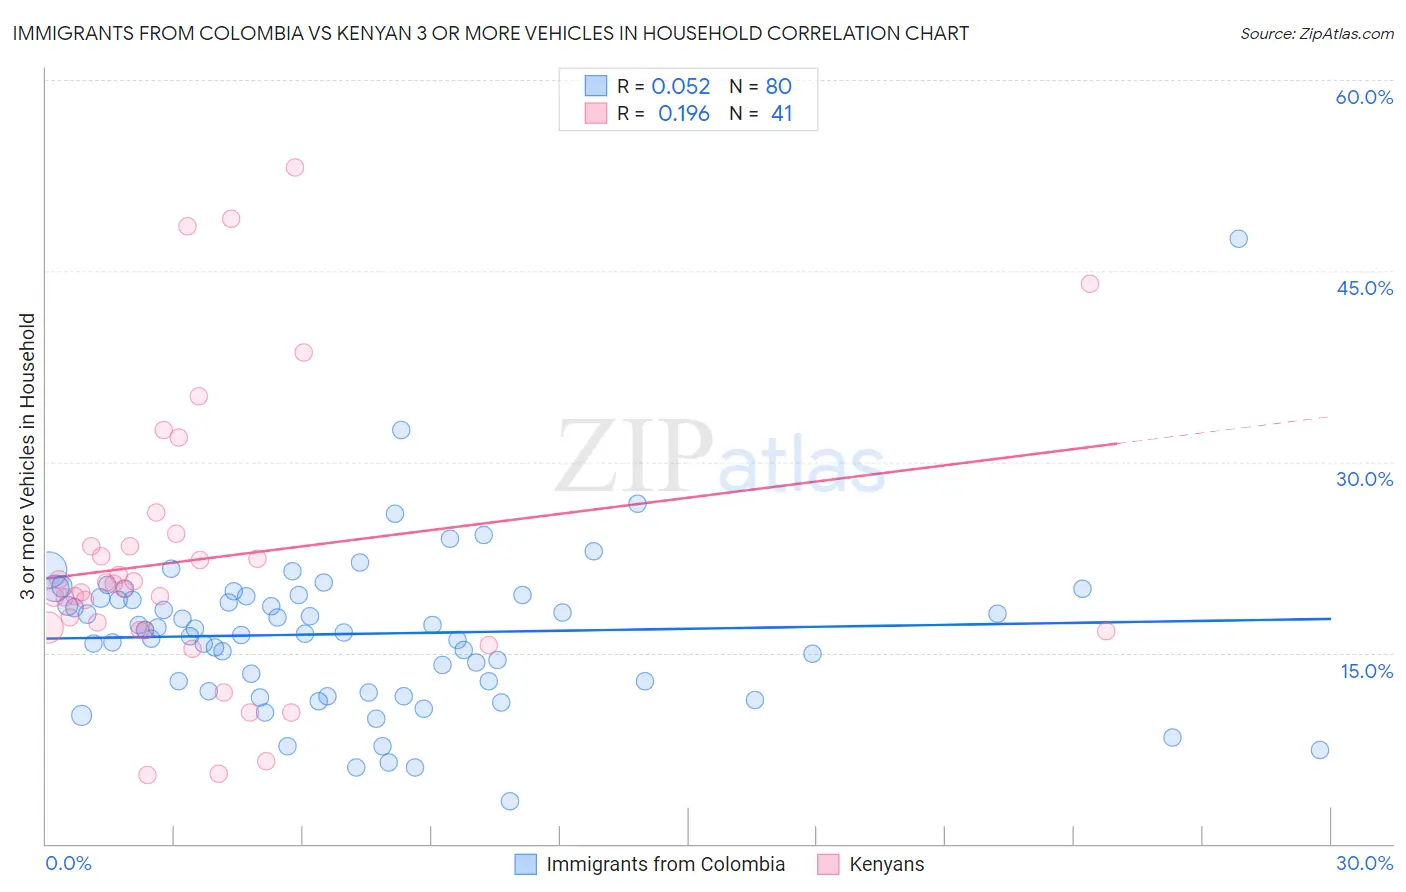
Immigrants from Colombia vs Kenyan 3 or more Vehicles in Household Correlation Chart
The statistical analysis conducted on geographies consisting of 378,439,541 people shows a slight positive correlation between the proportion of Immigrants from Colombia and percentage of households with 3 or more vehicles available in the United States with a correlation coefficient (R) of 0.052 and weighted average of 17.3%. Similarly, the statistical analysis conducted on geographies consisting of 168,140,381 people shows a poor positive correlation between the proportion of Kenyans and percentage of households with 3 or more vehicles available in the United States with a correlation coefficient (R) of 0.196 and weighted average of 19.1%, a difference of 10.3%.
3 or more Vehicles in Household Correlation Summary
| Measurement | Immigrants from Colombia | Kenyan |
| Minimum | 3.3% | 5.4% |
| Maximum | 47.5% | 53.1% |
| Range | 44.2% | 47.7% |
| Mean | 16.5% | 22.5% |
| Median | 16.7% | 20.1% |
| Interquartile 25% (IQ1) | 12.4% | 16.8% |
| Interquartile 75% (IQ3) | 19.5% | 23.9% |
| Interquartile Range (IQR) | 7.1% | 7.1% |
| Standard Deviation (Sample) | 6.3% | 11.2% |
| Standard Deviation (Population) | 6.2% | 11.1% |
Similar Demographics by 3 or more Vehicles in Household
Demographics Similar to Immigrants from Colombia by 3 or more Vehicles in Household
In terms of 3 or more vehicles in household, the demographic groups most similar to Immigrants from Colombia are Black/African American (17.3%, a difference of 0.12%), Immigrants from Ireland (17.3%, a difference of 0.17%), Immigrants from Latvia (17.4%, a difference of 0.46%), Immigrants from Eastern Europe (17.4%, a difference of 0.50%), and Immigrants from Kazakhstan (17.4%, a difference of 0.54%).
| Demographics | Rating | Rank | 3 or more Vehicles in Household |
| Brazilians | 0.4 /100 | #277 | Tragic 17.4% |
| Immigrants | Bahamas | 0.3 /100 | #278 | Tragic 17.4% |
| Immigrants | Kazakhstan | 0.3 /100 | #279 | Tragic 17.4% |
| Immigrants | Eastern Europe | 0.3 /100 | #280 | Tragic 17.4% |
| Immigrants | Latvia | 0.3 /100 | #281 | Tragic 17.4% |
| Immigrants | Ireland | 0.3 /100 | #282 | Tragic 17.3% |
| Blacks/African Americans | 0.3 /100 | #283 | Tragic 17.3% |
| Immigrants | Colombia | 0.3 /100 | #284 | Tragic 17.3% |
| Immigrants | Croatia | 0.2 /100 | #285 | Tragic 17.2% |
| Menominee | 0.2 /100 | #286 | Tragic 17.2% |
| Immigrants | Brazil | 0.2 /100 | #287 | Tragic 17.1% |
| Immigrants | Uruguay | 0.2 /100 | #288 | Tragic 17.1% |
| Immigrants | Liberia | 0.1 /100 | #289 | Tragic 17.1% |
| Liberians | 0.1 /100 | #290 | Tragic 17.0% |
| Immigrants | Congo | 0.1 /100 | #291 | Tragic 17.0% |
Demographics Similar to Kenyans by 3 or more Vehicles in Household
In terms of 3 or more vehicles in household, the demographic groups most similar to Kenyans are Tsimshian (19.1%, a difference of 0.030%), South American Indian (19.1%, a difference of 0.060%), Immigrants from Zimbabwe (19.1%, a difference of 0.080%), Serbian (19.1%, a difference of 0.080%), and Immigrants from Moldova (19.1%, a difference of 0.11%).
| Demographics | Rating | Rank | 3 or more Vehicles in Household |
| Immigrants | Sri Lanka | 30.7 /100 | #185 | Fair 19.2% |
| Immigrants | Sweden | 29.0 /100 | #186 | Fair 19.2% |
| Immigrants | Hong Kong | 28.3 /100 | #187 | Fair 19.2% |
| Immigrants | Kuwait | 26.1 /100 | #188 | Fair 19.1% |
| Indians (Asian) | 26.0 /100 | #189 | Fair 19.1% |
| Immigrants | Zimbabwe | 25.5 /100 | #190 | Fair 19.1% |
| South American Indians | 25.4 /100 | #191 | Fair 19.1% |
| Kenyans | 24.7 /100 | #192 | Fair 19.1% |
| Tsimshian | 24.4 /100 | #193 | Fair 19.1% |
| Serbians | 24.0 /100 | #194 | Fair 19.1% |
| Immigrants | Moldova | 23.6 /100 | #195 | Fair 19.1% |
| Central American Indians | 22.2 /100 | #196 | Fair 19.0% |
| Immigrants | Japan | 22.0 /100 | #197 | Fair 19.0% |
| Egyptians | 19.5 /100 | #198 | Poor 19.0% |
| Immigrants | Norway | 19.0 /100 | #199 | Poor 19.0% |