Immigrants from China vs Ghanaian 4 or more Vehicles in Household
COMPARE
Immigrants from China
Ghanaian
4 or more Vehicles in Household
4 or more Vehicles in Household Comparison
Immigrants from China
Ghanaians
6.0%
4 OR MORE VEHICLES IN HOUSEHOLD
13.8/ 100
METRIC RATING
215th/ 347
METRIC RANK
5.2%
4 OR MORE VEHICLES IN HOUSEHOLD
0.1/ 100
METRIC RATING
294th/ 347
METRIC RANK
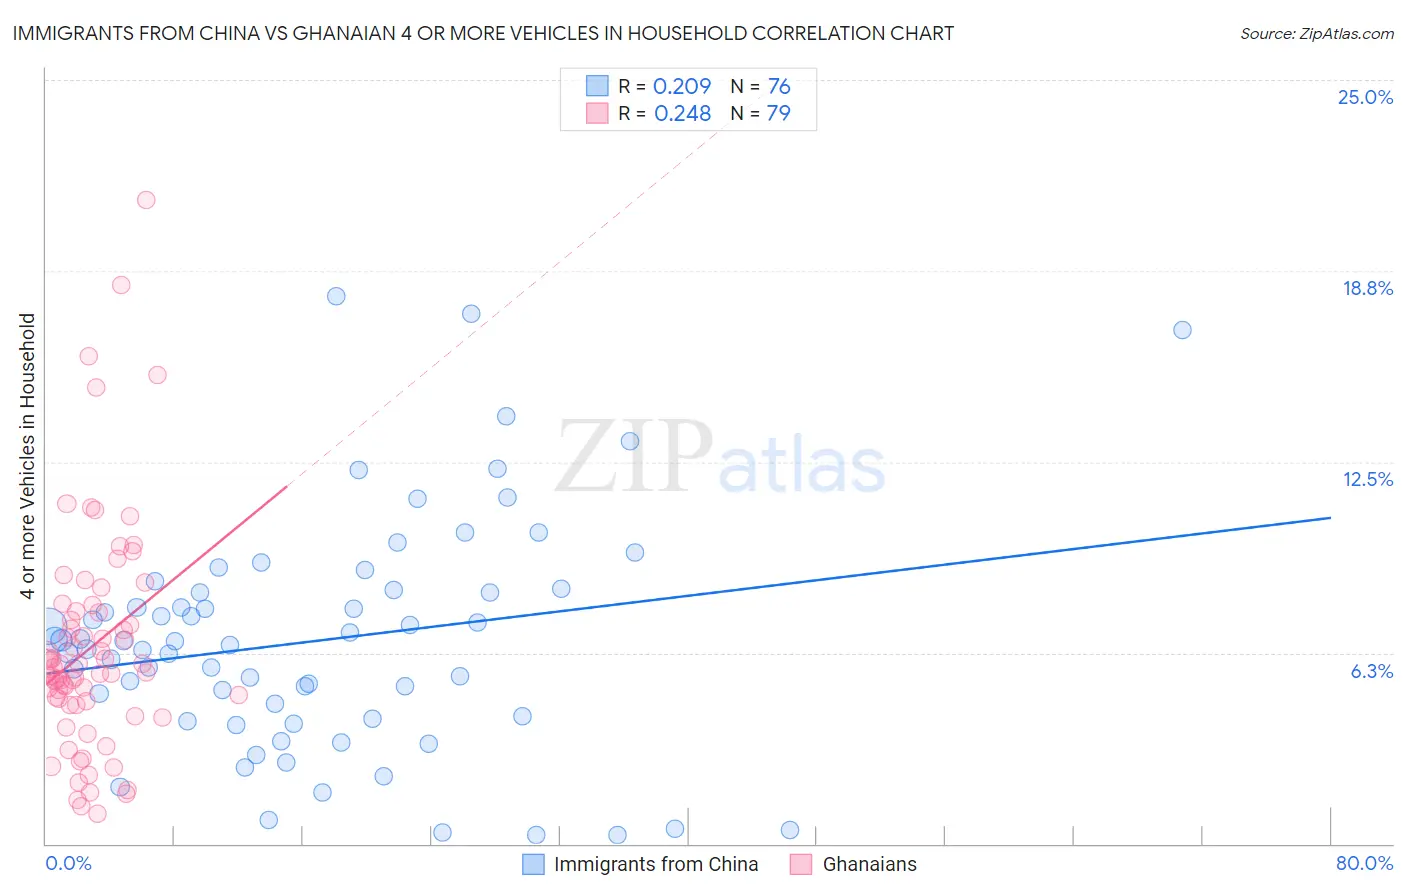
Immigrants from China vs Ghanaian 4 or more Vehicles in Household Correlation Chart
The statistical analysis conducted on geographies consisting of 454,562,757 people shows a weak positive correlation between the proportion of Immigrants from China and percentage of households with 4 or more vehicles available in the United States with a correlation coefficient (R) of 0.209 and weighted average of 6.0%. Similarly, the statistical analysis conducted on geographies consisting of 189,616,639 people shows a weak positive correlation between the proportion of Ghanaians and percentage of households with 4 or more vehicles available in the United States with a correlation coefficient (R) of 0.248 and weighted average of 5.2%, a difference of 15.0%.
4 or more Vehicles in Household Correlation Summary
| Measurement | Immigrants from China | Ghanaian |
| Minimum | 0.27% | 0.97% |
| Maximum | 17.9% | 21.1% |
| Range | 17.7% | 20.1% |
| Mean | 6.6% | 6.4% |
| Median | 6.6% | 5.8% |
| Interquartile 25% (IQ1) | 4.1% | 4.6% |
| Interquartile 75% (IQ3) | 8.3% | 7.6% |
| Interquartile Range (IQR) | 4.1% | 3.1% |
| Standard Deviation (Sample) | 3.8% | 3.7% |
| Standard Deviation (Population) | 3.8% | 3.7% |
Similar Demographics by 4 or more Vehicles in Household
Demographics Similar to Immigrants from China by 4 or more Vehicles in Household
In terms of 4 or more vehicles in household, the demographic groups most similar to Immigrants from China are Immigrants from Romania (6.0%, a difference of 0.0%), Immigrants from Austria (6.0%, a difference of 0.11%), Arab (6.0%, a difference of 0.13%), Immigrants from Egypt (6.0%, a difference of 0.19%), and Panamanian (6.0%, a difference of 0.20%).
| Demographics | Rating | Rank | 4 or more Vehicles in Household |
| Immigrants | Nigeria | 15.6 /100 | #208 | Poor 6.1% |
| Immigrants | Honduras | 15.4 /100 | #209 | Poor 6.1% |
| Immigrants | Zimbabwe | 15.1 /100 | #210 | Poor 6.0% |
| Panamanians | 14.8 /100 | #211 | Poor 6.0% |
| Immigrants | Egypt | 14.7 /100 | #212 | Poor 6.0% |
| Arabs | 14.4 /100 | #213 | Poor 6.0% |
| Immigrants | Austria | 14.3 /100 | #214 | Poor 6.0% |
| Immigrants | China | 13.8 /100 | #215 | Poor 6.0% |
| Immigrants | Romania | 13.8 /100 | #216 | Poor 6.0% |
| Nigerians | 12.2 /100 | #217 | Poor 6.0% |
| Immigrants | Italy | 11.0 /100 | #218 | Poor 6.0% |
| Serbians | 11.0 /100 | #219 | Poor 6.0% |
| Russians | 10.3 /100 | #220 | Poor 6.0% |
| Immigrants | Moldova | 9.3 /100 | #221 | Tragic 6.0% |
| Cajuns | 9.2 /100 | #222 | Tragic 6.0% |
Demographics Similar to Ghanaians by 4 or more Vehicles in Household
In terms of 4 or more vehicles in household, the demographic groups most similar to Ghanaians are Immigrants from Congo (5.2%, a difference of 0.050%), Liberian (5.3%, a difference of 0.090%), Immigrants from Brazil (5.2%, a difference of 0.11%), Immigrants from Bahamas (5.3%, a difference of 0.19%), and Israeli (5.2%, a difference of 0.29%).
| Demographics | Rating | Rank | 4 or more Vehicles in Household |
| Immigrants | Croatia | 0.2 /100 | #287 | Tragic 5.4% |
| Venezuelans | 0.2 /100 | #288 | Tragic 5.3% |
| Immigrants | Bosnia and Herzegovina | 0.2 /100 | #289 | Tragic 5.3% |
| Immigrants | Russia | 0.2 /100 | #290 | Tragic 5.3% |
| Immigrants | Bahamas | 0.1 /100 | #291 | Tragic 5.3% |
| Liberians | 0.1 /100 | #292 | Tragic 5.3% |
| Immigrants | Congo | 0.1 /100 | #293 | Tragic 5.2% |
| Ghanaians | 0.1 /100 | #294 | Tragic 5.2% |
| Immigrants | Brazil | 0.1 /100 | #295 | Tragic 5.2% |
| Israelis | 0.1 /100 | #296 | Tragic 5.2% |
| Immigrants | Venezuela | 0.1 /100 | #297 | Tragic 5.2% |
| Immigrants | South America | 0.1 /100 | #298 | Tragic 5.2% |
| Immigrants | Ghana | 0.1 /100 | #299 | Tragic 5.2% |
| Immigrants | Morocco | 0.0 /100 | #300 | Tragic 5.1% |
| Immigrants | Zaire | 0.0 /100 | #301 | Tragic 5.1% |