Immigrants from China vs Ugandan 4 or more Vehicles in Household
COMPARE
Immigrants from China
Ugandan
4 or more Vehicles in Household
4 or more Vehicles in Household Comparison
Immigrants from China
Ugandans
6.0%
4 OR MORE VEHICLES IN HOUSEHOLD
13.8/ 100
METRIC RATING
215th/ 347
METRIC RANK
5.7%
4 OR MORE VEHICLES IN HOUSEHOLD
2.2/ 100
METRIC RATING
251st/ 347
METRIC RANK
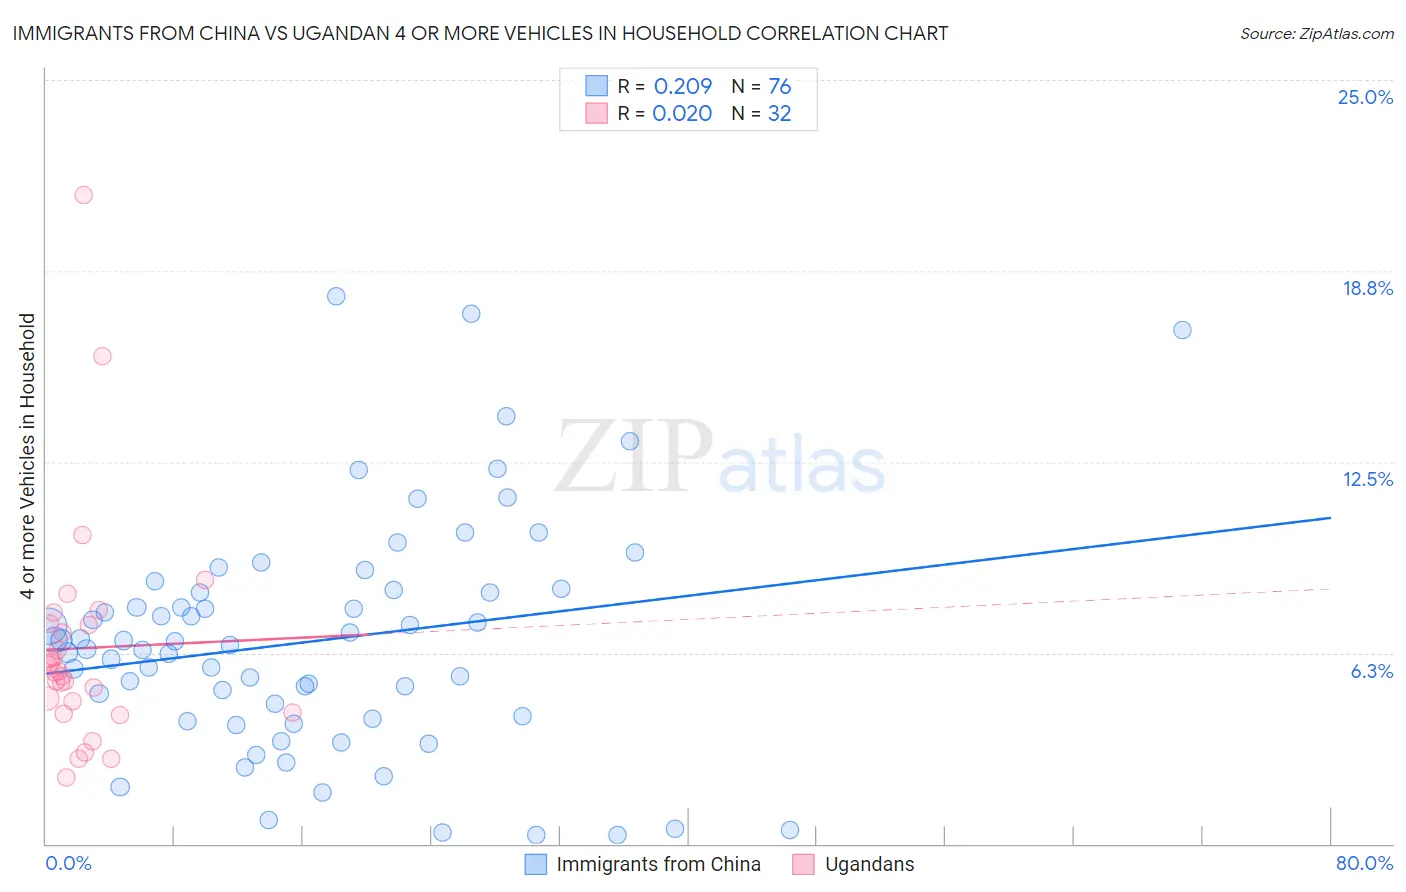
Immigrants from China vs Ugandan 4 or more Vehicles in Household Correlation Chart
The statistical analysis conducted on geographies consisting of 454,562,757 people shows a weak positive correlation between the proportion of Immigrants from China and percentage of households with 4 or more vehicles available in the United States with a correlation coefficient (R) of 0.209 and weighted average of 6.0%. Similarly, the statistical analysis conducted on geographies consisting of 93,911,160 people shows no correlation between the proportion of Ugandans and percentage of households with 4 or more vehicles available in the United States with a correlation coefficient (R) of 0.020 and weighted average of 5.7%, a difference of 5.4%.
4 or more Vehicles in Household Correlation Summary
| Measurement | Immigrants from China | Ugandan |
| Minimum | 0.27% | 2.2% |
| Maximum | 17.9% | 21.2% |
| Range | 17.7% | 19.1% |
| Mean | 6.6% | 6.4% |
| Median | 6.6% | 5.6% |
| Interquartile 25% (IQ1) | 4.1% | 4.5% |
| Interquartile 75% (IQ3) | 8.3% | 7.2% |
| Interquartile Range (IQR) | 4.1% | 2.7% |
| Standard Deviation (Sample) | 3.8% | 3.7% |
| Standard Deviation (Population) | 3.8% | 3.7% |
Similar Demographics by 4 or more Vehicles in Household
Demographics Similar to Immigrants from China by 4 or more Vehicles in Household
In terms of 4 or more vehicles in household, the demographic groups most similar to Immigrants from China are Immigrants from Romania (6.0%, a difference of 0.0%), Immigrants from Austria (6.0%, a difference of 0.11%), Arab (6.0%, a difference of 0.13%), Immigrants from Egypt (6.0%, a difference of 0.19%), and Panamanian (6.0%, a difference of 0.20%).
| Demographics | Rating | Rank | 4 or more Vehicles in Household |
| Immigrants | Nigeria | 15.6 /100 | #208 | Poor 6.1% |
| Immigrants | Honduras | 15.4 /100 | #209 | Poor 6.1% |
| Immigrants | Zimbabwe | 15.1 /100 | #210 | Poor 6.0% |
| Panamanians | 14.8 /100 | #211 | Poor 6.0% |
| Immigrants | Egypt | 14.7 /100 | #212 | Poor 6.0% |
| Arabs | 14.4 /100 | #213 | Poor 6.0% |
| Immigrants | Austria | 14.3 /100 | #214 | Poor 6.0% |
| Immigrants | China | 13.8 /100 | #215 | Poor 6.0% |
| Immigrants | Romania | 13.8 /100 | #216 | Poor 6.0% |
| Nigerians | 12.2 /100 | #217 | Poor 6.0% |
| Immigrants | Italy | 11.0 /100 | #218 | Poor 6.0% |
| Serbians | 11.0 /100 | #219 | Poor 6.0% |
| Russians | 10.3 /100 | #220 | Poor 6.0% |
| Immigrants | Moldova | 9.3 /100 | #221 | Tragic 6.0% |
| Cajuns | 9.2 /100 | #222 | Tragic 6.0% |
Demographics Similar to Ugandans by 4 or more Vehicles in Household
In terms of 4 or more vehicles in household, the demographic groups most similar to Ugandans are Immigrants from Europe (5.7%, a difference of 0.020%), Immigrants from Southern Europe (5.7%, a difference of 0.12%), Immigrants from Eastern Africa (5.7%, a difference of 0.14%), Subsaharan African (5.7%, a difference of 0.23%), and Immigrants from Ethiopia (5.7%, a difference of 0.25%).
| Demographics | Rating | Rank | 4 or more Vehicles in Household |
| Ethiopians | 3.2 /100 | #244 | Tragic 5.8% |
| Bulgarians | 3.1 /100 | #245 | Tragic 5.8% |
| Immigrants | North Macedonia | 2.5 /100 | #246 | Tragic 5.7% |
| Immigrants | Ethiopia | 2.4 /100 | #247 | Tragic 5.7% |
| Immigrants | Eastern Africa | 2.4 /100 | #248 | Tragic 5.7% |
| Immigrants | Southern Europe | 2.3 /100 | #249 | Tragic 5.7% |
| Immigrants | Europe | 2.3 /100 | #250 | Tragic 5.7% |
| Ugandans | 2.2 /100 | #251 | Tragic 5.7% |
| Sub-Saharan Africans | 2.1 /100 | #252 | Tragic 5.7% |
| Immigrants | Cuba | 1.6 /100 | #253 | Tragic 5.7% |
| Immigrants | Panama | 1.5 /100 | #254 | Tragic 5.7% |
| Yup'ik | 1.5 /100 | #255 | Tragic 5.7% |
| Immigrants | Turkey | 1.5 /100 | #256 | Tragic 5.7% |
| Immigrants | Northern Africa | 1.4 /100 | #257 | Tragic 5.6% |
| Immigrants | Lithuania | 1.4 /100 | #258 | Tragic 5.6% |