Immigrants from China vs Apache Male Unemployment
COMPARE
Immigrants from China
Apache
Male Unemployment
Male Unemployment Comparison
Immigrants from China
Apache
5.2%
MALE UNEMPLOYMENT
70.6/ 100
METRIC RATING
161st/ 347
METRIC RANK
8.6%
MALE UNEMPLOYMENT
0.0/ 100
METRIC RATING
338th/ 347
METRIC RANK
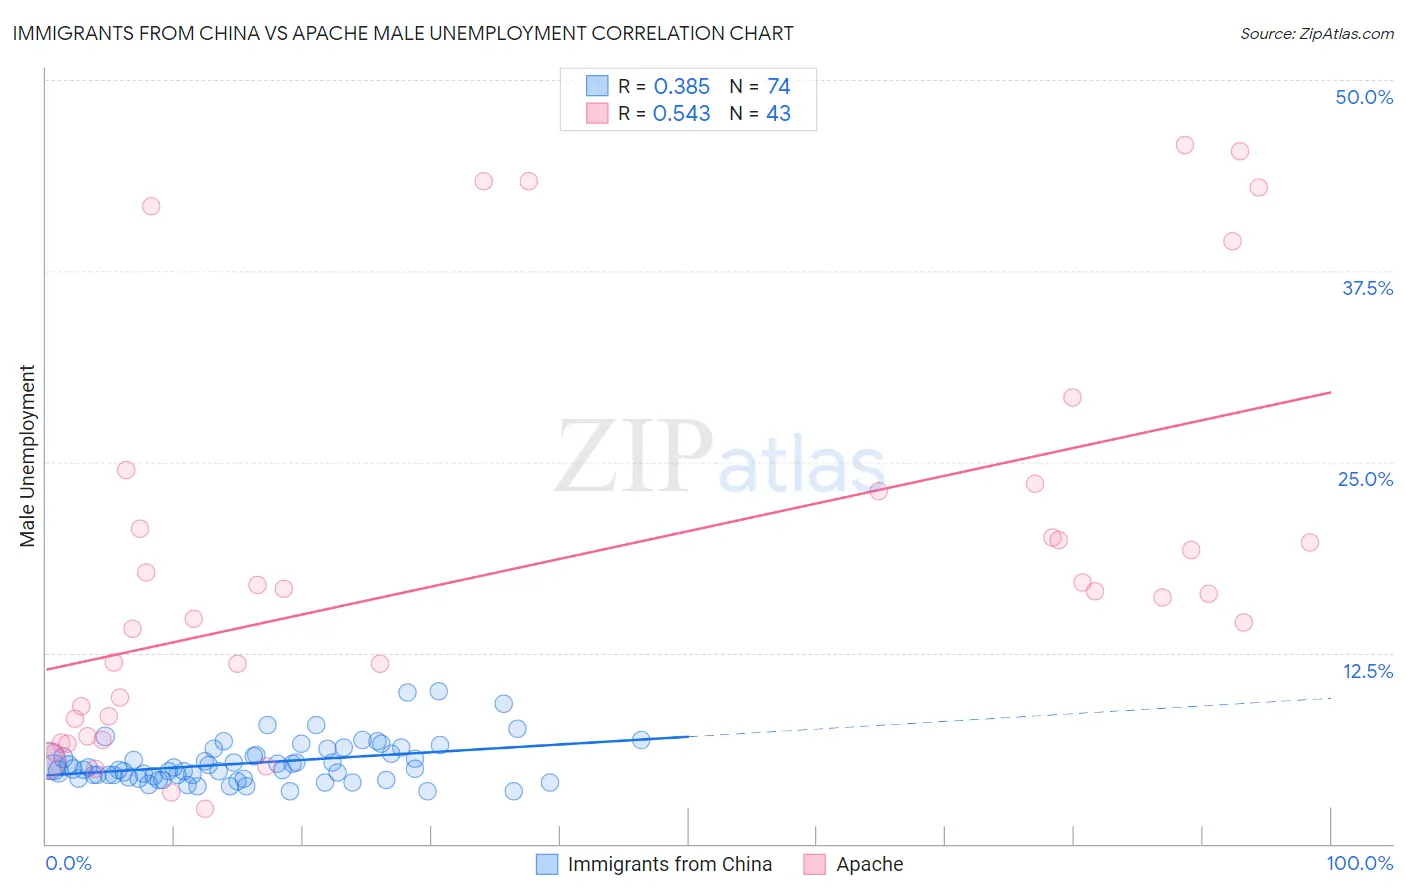
Immigrants from China vs Apache Male Unemployment Correlation Chart
The statistical analysis conducted on geographies consisting of 454,688,998 people shows a mild positive correlation between the proportion of Immigrants from China and unemployment rate among males in the United States with a correlation coefficient (R) of 0.385 and weighted average of 5.2%. Similarly, the statistical analysis conducted on geographies consisting of 230,425,231 people shows a substantial positive correlation between the proportion of Apache and unemployment rate among males in the United States with a correlation coefficient (R) of 0.543 and weighted average of 8.6%, a difference of 64.6%.
Male Unemployment Correlation Summary
| Measurement | Immigrants from China | Apache |
| Minimum | 3.4% | 2.3% |
| Maximum | 10.0% | 45.7% |
| Range | 6.6% | 43.4% |
| Mean | 5.3% | 18.3% |
| Median | 4.9% | 16.4% |
| Interquartile 25% (IQ1) | 4.3% | 8.2% |
| Interquartile 75% (IQ3) | 5.9% | 23.1% |
| Interquartile Range (IQR) | 1.5% | 14.9% |
| Standard Deviation (Sample) | 1.4% | 12.7% |
| Standard Deviation (Population) | 1.4% | 12.6% |
Similar Demographics by Male Unemployment
Demographics Similar to Immigrants from China by Male Unemployment
In terms of male unemployment, the demographic groups most similar to Immigrants from China are Immigrants from Norway (5.2%, a difference of 0.030%), Indonesian (5.2%, a difference of 0.040%), Immigrants from Indonesia (5.2%, a difference of 0.070%), Immigrants from Northern Africa (5.2%, a difference of 0.12%), and American (5.2%, a difference of 0.15%).
| Demographics | Rating | Rank | Male Unemployment |
| Laotians | 73.8 /100 | #154 | Good 5.2% |
| Immigrants | Hungary | 73.4 /100 | #155 | Good 5.2% |
| Americans | 72.7 /100 | #156 | Good 5.2% |
| Immigrants | Northern Africa | 72.3 /100 | #157 | Good 5.2% |
| Immigrants | Indonesia | 71.5 /100 | #158 | Good 5.2% |
| Indonesians | 71.2 /100 | #159 | Good 5.2% |
| Immigrants | Norway | 71.0 /100 | #160 | Good 5.2% |
| Immigrants | China | 70.6 /100 | #161 | Good 5.2% |
| Immigrants | Egypt | 65.9 /100 | #162 | Good 5.2% |
| Immigrants | Hong Kong | 65.7 /100 | #163 | Good 5.2% |
| Afghans | 62.0 /100 | #164 | Good 5.3% |
| South Americans | 60.6 /100 | #165 | Good 5.3% |
| Immigrants | Morocco | 60.2 /100 | #166 | Good 5.3% |
| Immigrants | Vietnam | 58.1 /100 | #167 | Average 5.3% |
| Immigrants | Ireland | 57.7 /100 | #168 | Average 5.3% |
Demographics Similar to Apache by Male Unemployment
In terms of male unemployment, the demographic groups most similar to Apache are Puerto Rican (8.6%, a difference of 0.15%), Yuman (8.6%, a difference of 0.23%), Pueblo (8.5%, a difference of 1.6%), Tsimshian (8.5%, a difference of 1.7%), and Sioux (8.4%, a difference of 2.6%).
| Demographics | Rating | Rank | Male Unemployment |
| Alaska Natives | 0.0 /100 | #331 | Tragic 8.1% |
| Pima | 0.0 /100 | #332 | Tragic 8.3% |
| Sioux | 0.0 /100 | #333 | Tragic 8.4% |
| Tsimshian | 0.0 /100 | #334 | Tragic 8.5% |
| Pueblo | 0.0 /100 | #335 | Tragic 8.5% |
| Yuman | 0.0 /100 | #336 | Tragic 8.6% |
| Puerto Ricans | 0.0 /100 | #337 | Tragic 8.6% |
| Apache | 0.0 /100 | #338 | Tragic 8.6% |
| Cheyenne | 0.0 /100 | #339 | Tragic 9.8% |
| Alaskan Athabascans | 0.0 /100 | #340 | Tragic 9.8% |
| Navajo | 0.0 /100 | #341 | Tragic 9.8% |
| Tohono O'odham | 0.0 /100 | #342 | Tragic 10.2% |
| Crow | 0.0 /100 | #343 | Tragic 10.6% |
| Hopi | 0.0 /100 | #344 | Tragic 10.8% |
| Arapaho | 0.0 /100 | #345 | Tragic 11.0% |