Immigrants from China vs Apache Female Poverty Among 18-24 Year Olds
COMPARE
Immigrants from China
Apache
Female Poverty Among 18-24 Year Olds
Female Poverty Among 18-24 Year Olds Comparison
Immigrants from China
Apache
20.2%
FEMALE POVERTY AMONG 18-24 YEAR OLDS
43.0/ 100
METRIC RATING
181st/ 347
METRIC RANK
26.3%
FEMALE POVERTY AMONG 18-24 YEAR OLDS
0.0/ 100
METRIC RATING
333rd/ 347
METRIC RANK
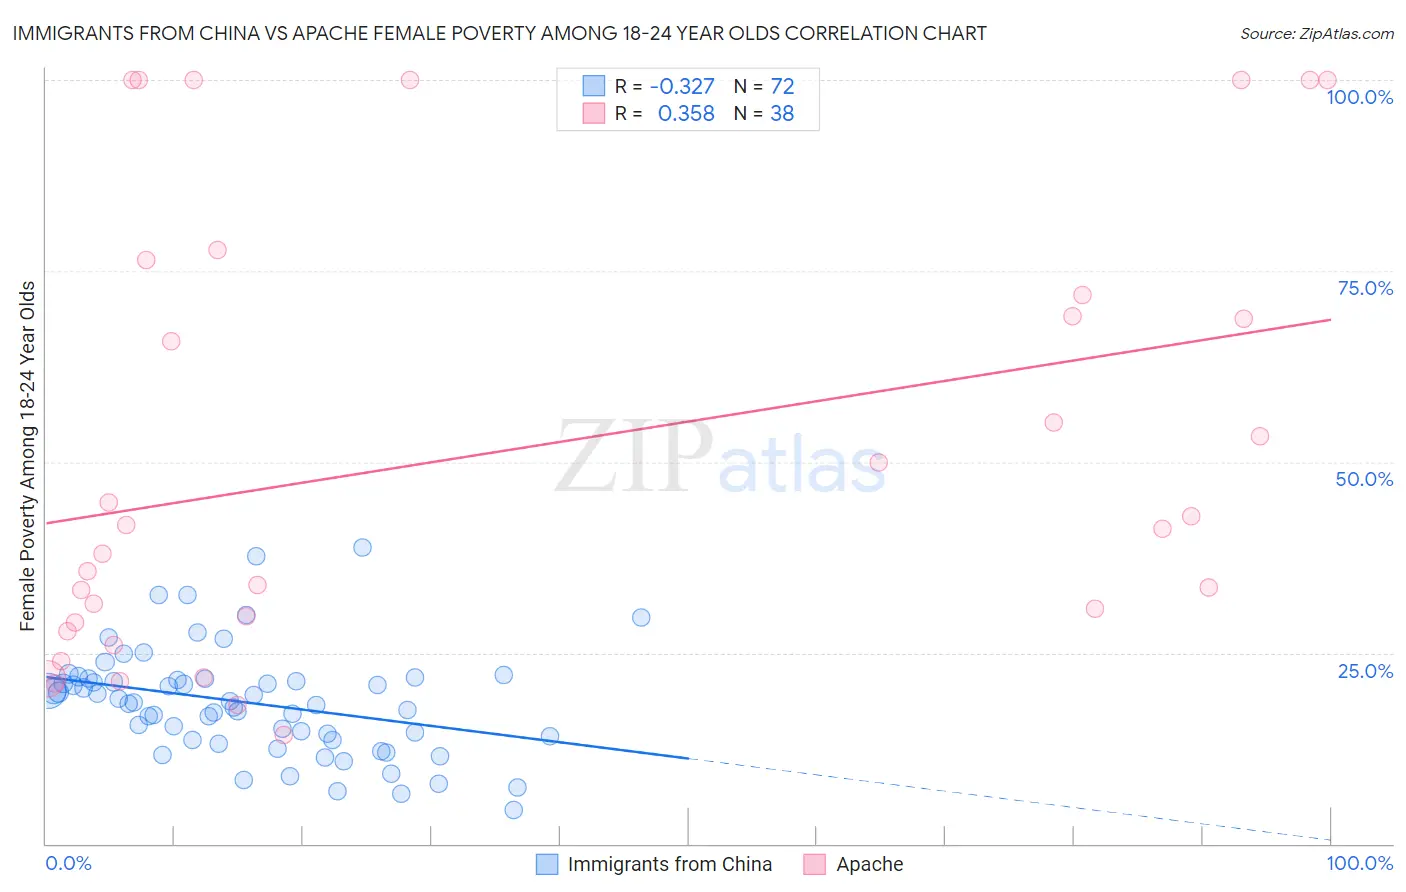
Immigrants from China vs Apache Female Poverty Among 18-24 Year Olds Correlation Chart
The statistical analysis conducted on geographies consisting of 442,287,819 people shows a mild negative correlation between the proportion of Immigrants from China and poverty level among females between the ages 18 and 24 in the United States with a correlation coefficient (R) of -0.327 and weighted average of 20.2%. Similarly, the statistical analysis conducted on geographies consisting of 228,623,137 people shows a mild positive correlation between the proportion of Apache and poverty level among females between the ages 18 and 24 in the United States with a correlation coefficient (R) of 0.358 and weighted average of 26.3%, a difference of 30.5%.
Female Poverty Among 18-24 Year Olds Correlation Summary
| Measurement | Immigrants from China | Apache |
| Minimum | 4.3% | 14.3% |
| Maximum | 38.8% | 100.0% |
| Range | 34.4% | 85.7% |
| Mean | 18.5% | 51.3% |
| Median | 18.6% | 41.5% |
| Interquartile 25% (IQ1) | 13.9% | 28.9% |
| Interquartile 75% (IQ3) | 21.5% | 71.9% |
| Interquartile Range (IQR) | 7.6% | 42.9% |
| Standard Deviation (Sample) | 6.9% | 28.8% |
| Standard Deviation (Population) | 6.9% | 28.4% |
Similar Demographics by Female Poverty Among 18-24 Year Olds
Demographics Similar to Immigrants from China by Female Poverty Among 18-24 Year Olds
In terms of female poverty among 18-24 year olds, the demographic groups most similar to Immigrants from China are Immigrants from Barbados (20.2%, a difference of 0.010%), Iraqi (20.2%, a difference of 0.020%), Ethiopian (20.2%, a difference of 0.040%), Swiss (20.2%, a difference of 0.050%), and Immigrants from Kazakhstan (20.2%, a difference of 0.060%).
| Demographics | Rating | Rank | Female Poverty Among 18-24 Year Olds |
| Swedes | 50.0 /100 | #174 | Average 20.1% |
| South American Indians | 48.4 /100 | #175 | Average 20.1% |
| Kenyans | 44.9 /100 | #176 | Average 20.2% |
| Immigrants | Kazakhstan | 44.2 /100 | #177 | Average 20.2% |
| Swiss | 44.0 /100 | #178 | Average 20.2% |
| Ethiopians | 43.8 /100 | #179 | Average 20.2% |
| Iraqis | 43.3 /100 | #180 | Average 20.2% |
| Immigrants | China | 43.0 /100 | #181 | Average 20.2% |
| Immigrants | Barbados | 42.8 /100 | #182 | Average 20.2% |
| Lebanese | 40.6 /100 | #183 | Average 20.2% |
| Immigrants | Central America | 39.9 /100 | #184 | Fair 20.2% |
| Nepalese | 39.7 /100 | #185 | Fair 20.2% |
| Immigrants | Ethiopia | 37.3 /100 | #186 | Fair 20.2% |
| Immigrants | Mexico | 36.3 /100 | #187 | Fair 20.2% |
| Scandinavians | 34.6 /100 | #188 | Fair 20.3% |
Demographics Similar to Apache by Female Poverty Among 18-24 Year Olds
In terms of female poverty among 18-24 year olds, the demographic groups most similar to Apache are Houma (26.2%, a difference of 0.53%), Chippewa (25.9%, a difference of 1.6%), Pueblo (26.9%, a difference of 2.2%), Immigrants from Somalia (25.7%, a difference of 2.2%), and Cajun (25.7%, a difference of 2.5%).
| Demographics | Rating | Rank | Female Poverty Among 18-24 Year Olds |
| Yakama | 0.0 /100 | #326 | Tragic 25.3% |
| Ute | 0.0 /100 | #327 | Tragic 25.4% |
| Natives/Alaskans | 0.0 /100 | #328 | Tragic 25.4% |
| Cajuns | 0.0 /100 | #329 | Tragic 25.7% |
| Immigrants | Somalia | 0.0 /100 | #330 | Tragic 25.7% |
| Chippewa | 0.0 /100 | #331 | Tragic 25.9% |
| Houma | 0.0 /100 | #332 | Tragic 26.2% |
| Apache | 0.0 /100 | #333 | Tragic 26.3% |
| Pueblo | 0.0 /100 | #334 | Tragic 26.9% |
| Yup'ik | 0.0 /100 | #335 | Tragic 27.0% |
| Immigrants | Yemen | 0.0 /100 | #336 | Tragic 27.5% |
| Cheyenne | 0.0 /100 | #337 | Tragic 28.1% |
| Hopi | 0.0 /100 | #338 | Tragic 28.2% |
| Pima | 0.0 /100 | #339 | Tragic 28.4% |
| Sioux | 0.0 /100 | #340 | Tragic 28.6% |