Immigrants from Canada vs Immigrants from Austria 2 or more Vehicles in Household
COMPARE
Immigrants from Canada
Immigrants from Austria
2 or more Vehicles in Household
2 or more Vehicles in Household Comparison
Immigrants from Canada
Immigrants from Austria
57.5%
2 OR MORE VEHICLES IN HOUSEHOLD
98.1/ 100
METRIC RATING
108th/ 347
METRIC RANK
55.5%
2 OR MORE VEHICLES IN HOUSEHOLD
56.3/ 100
METRIC RATING
169th/ 347
METRIC RANK
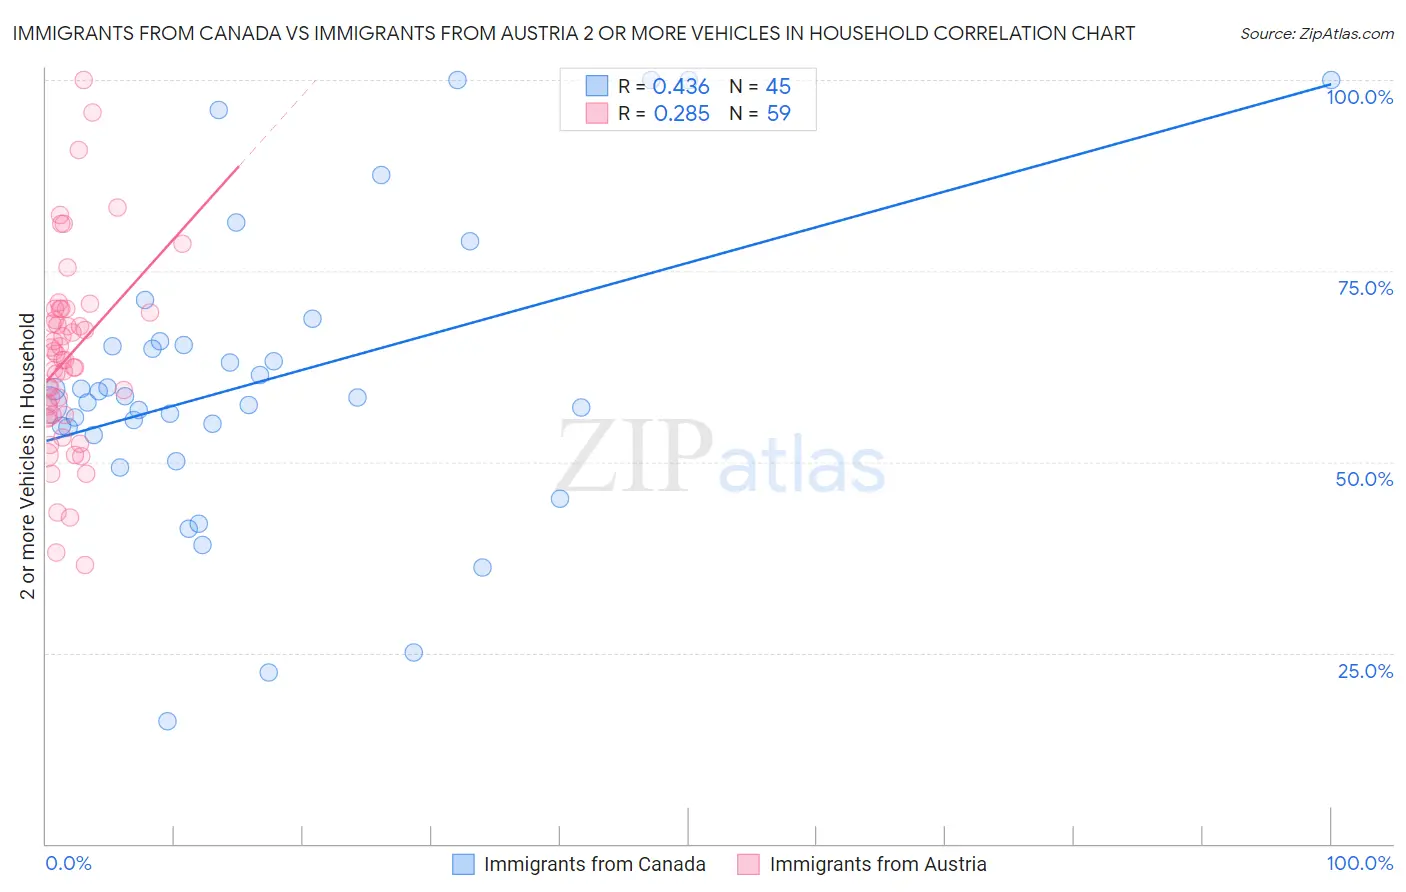
Immigrants from Canada vs Immigrants from Austria 2 or more Vehicles in Household Correlation Chart
The statistical analysis conducted on geographies consisting of 459,158,975 people shows a moderate positive correlation between the proportion of Immigrants from Canada and percentage of households with 2 or more vehicles available in the United States with a correlation coefficient (R) of 0.436 and weighted average of 57.5%. Similarly, the statistical analysis conducted on geographies consisting of 167,963,508 people shows a weak positive correlation between the proportion of Immigrants from Austria and percentage of households with 2 or more vehicles available in the United States with a correlation coefficient (R) of 0.285 and weighted average of 55.5%, a difference of 3.7%.
2 or more Vehicles in Household Correlation Summary
| Measurement | Immigrants from Canada | Immigrants from Austria |
| Minimum | 16.0% | 36.4% |
| Maximum | 100.0% | 100.0% |
| Range | 84.0% | 63.6% |
| Mean | 60.6% | 63.8% |
| Median | 58.4% | 63.4% |
| Interquartile 25% (IQ1) | 54.1% | 56.1% |
| Interquartile 75% (IQ3) | 65.5% | 70.0% |
| Interquartile Range (IQR) | 11.4% | 13.9% |
| Standard Deviation (Sample) | 19.4% | 12.6% |
| Standard Deviation (Population) | 19.1% | 12.5% |
Similar Demographics by 2 or more Vehicles in Household
Demographics Similar to Immigrants from Canada by 2 or more Vehicles in Household
In terms of 2 or more vehicles in household, the demographic groups most similar to Immigrants from Canada are Immigrants from Netherlands (57.5%, a difference of 0.010%), Immigrants from Oceania (57.5%, a difference of 0.030%), Immigrants from North America (57.5%, a difference of 0.030%), Immigrants from Bolivia (57.6%, a difference of 0.050%), and Jordanian (57.6%, a difference of 0.050%).
| Demographics | Rating | Rank | 2 or more Vehicles in Household |
| Lebanese | 98.3 /100 | #101 | Exceptional 57.6% |
| Immigrants | Bolivia | 98.2 /100 | #102 | Exceptional 57.6% |
| Jordanians | 98.2 /100 | #103 | Exceptional 57.6% |
| Immigrants | Indonesia | 98.2 /100 | #104 | Exceptional 57.6% |
| Immigrants | Korea | 98.2 /100 | #105 | Exceptional 57.6% |
| Immigrants | Oceania | 98.2 /100 | #106 | Exceptional 57.5% |
| Immigrants | Netherlands | 98.2 /100 | #107 | Exceptional 57.5% |
| Immigrants | Canada | 98.1 /100 | #108 | Exceptional 57.5% |
| Immigrants | North America | 98.1 /100 | #109 | Exceptional 57.5% |
| Japanese | 98.0 /100 | #110 | Exceptional 57.5% |
| Greeks | 98.0 /100 | #111 | Exceptional 57.5% |
| Pueblo | 98.0 /100 | #112 | Exceptional 57.5% |
| Zimbabweans | 96.9 /100 | #113 | Exceptional 57.2% |
| Immigrants | Lebanon | 96.8 /100 | #114 | Exceptional 57.2% |
| Chippewa | 96.6 /100 | #115 | Exceptional 57.2% |
Demographics Similar to Immigrants from Austria by 2 or more Vehicles in Household
In terms of 2 or more vehicles in household, the demographic groups most similar to Immigrants from Austria are French American Indian (55.5%, a difference of 0.010%), Romanian (55.5%, a difference of 0.020%), Kenyan (55.5%, a difference of 0.070%), Immigrants from Sri Lanka (55.5%, a difference of 0.080%), and Immigrants from Costa Rica (55.4%, a difference of 0.080%).
| Demographics | Rating | Rank | 2 or more Vehicles in Household |
| German Russians | 60.9 /100 | #162 | Good 55.6% |
| Immigrants | Zimbabwe | 60.2 /100 | #163 | Good 55.6% |
| Dutch West Indians | 59.8 /100 | #164 | Average 55.6% |
| Immigrants | El Salvador | 59.4 /100 | #165 | Average 55.6% |
| Immigrants | Sri Lanka | 58.3 /100 | #166 | Average 55.5% |
| Kenyans | 58.1 /100 | #167 | Average 55.5% |
| French American Indians | 56.7 /100 | #168 | Average 55.5% |
| Immigrants | Austria | 56.3 /100 | #169 | Average 55.5% |
| Romanians | 55.8 /100 | #170 | Average 55.5% |
| Immigrants | Costa Rica | 54.4 /100 | #171 | Average 55.4% |
| Immigrants | Nicaragua | 51.6 /100 | #172 | Average 55.4% |
| Immigrants | Western Europe | 51.4 /100 | #173 | Average 55.4% |
| Navajo | 50.0 /100 | #174 | Average 55.3% |
| Immigrants | Denmark | 49.4 /100 | #175 | Average 55.3% |
| Immigrants | Cuba | 47.0 /100 | #176 | Average 55.3% |