Scotch-Irish vs Immigrants from Austria 2 or more Vehicles in Household
COMPARE
Scotch-Irish
Immigrants from Austria
2 or more Vehicles in Household
2 or more Vehicles in Household Comparison
Scotch-Irish
Immigrants from Austria
60.9%
2 OR MORE VEHICLES IN HOUSEHOLD
100.0/ 100
METRIC RATING
23rd/ 347
METRIC RANK
55.5%
2 OR MORE VEHICLES IN HOUSEHOLD
56.3/ 100
METRIC RATING
169th/ 347
METRIC RANK
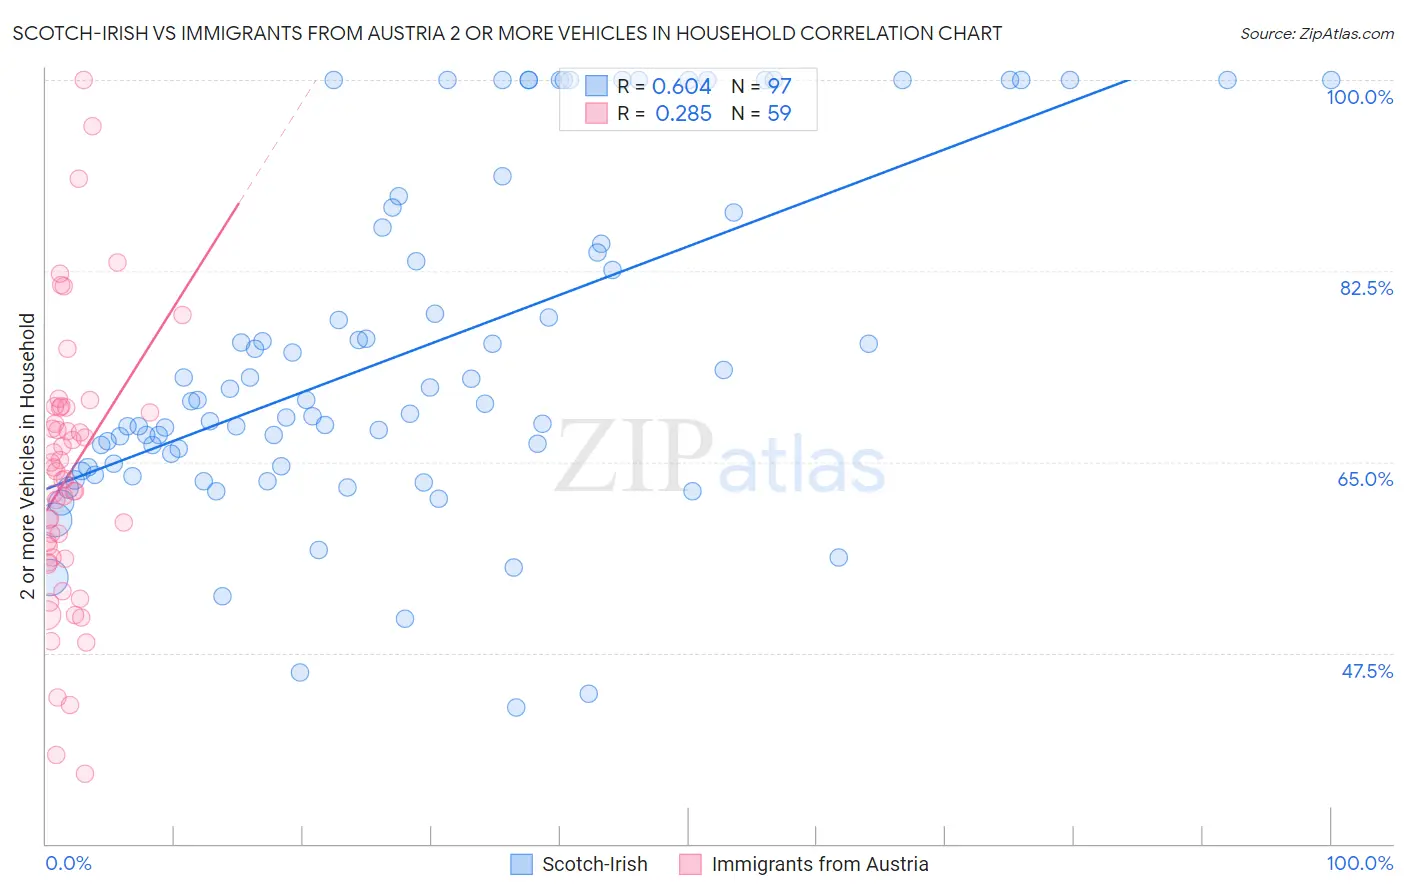
Scotch-Irish vs Immigrants from Austria 2 or more Vehicles in Household Correlation Chart
The statistical analysis conducted on geographies consisting of 548,429,166 people shows a significant positive correlation between the proportion of Scotch-Irish and percentage of households with 2 or more vehicles available in the United States with a correlation coefficient (R) of 0.604 and weighted average of 60.9%. Similarly, the statistical analysis conducted on geographies consisting of 167,963,508 people shows a weak positive correlation between the proportion of Immigrants from Austria and percentage of households with 2 or more vehicles available in the United States with a correlation coefficient (R) of 0.285 and weighted average of 55.5%, a difference of 9.8%.
2 or more Vehicles in Household Correlation Summary
| Measurement | Scotch-Irish | Immigrants from Austria |
| Minimum | 42.5% | 36.4% |
| Maximum | 100.0% | 100.0% |
| Range | 57.5% | 63.6% |
| Mean | 75.1% | 63.8% |
| Median | 70.6% | 63.4% |
| Interquartile 25% (IQ1) | 64.5% | 56.1% |
| Interquartile 75% (IQ3) | 87.2% | 70.0% |
| Interquartile Range (IQR) | 22.6% | 13.9% |
| Standard Deviation (Sample) | 15.5% | 12.6% |
| Standard Deviation (Population) | 15.4% | 12.5% |
Similar Demographics by 2 or more Vehicles in Household
Demographics Similar to Scotch-Irish by 2 or more Vehicles in Household
In terms of 2 or more vehicles in household, the demographic groups most similar to Scotch-Irish are Swiss (61.0%, a difference of 0.040%), Immigrants from Vietnam (60.9%, a difference of 0.040%), Korean (61.0%, a difference of 0.070%), Sri Lankan (61.0%, a difference of 0.12%), and White/Caucasian (60.8%, a difference of 0.19%).
| Demographics | Rating | Rank | 2 or more Vehicles in Household |
| Native Hawaiians | 100.0 /100 | #16 | Exceptional 61.4% |
| Basques | 100.0 /100 | #17 | Exceptional 61.4% |
| Europeans | 100.0 /100 | #18 | Exceptional 61.4% |
| Scottish | 100.0 /100 | #19 | Exceptional 61.2% |
| Sri Lankans | 100.0 /100 | #20 | Exceptional 61.0% |
| Koreans | 100.0 /100 | #21 | Exceptional 61.0% |
| Swiss | 100.0 /100 | #22 | Exceptional 61.0% |
| Scotch-Irish | 100.0 /100 | #23 | Exceptional 60.9% |
| Immigrants | Vietnam | 100.0 /100 | #24 | Exceptional 60.9% |
| Whites/Caucasians | 100.0 /100 | #25 | Exceptional 60.8% |
| Welsh | 100.0 /100 | #26 | Exceptional 60.8% |
| Assyrians/Chaldeans/Syriacs | 100.0 /100 | #27 | Exceptional 60.5% |
| Guamanians/Chamorros | 100.0 /100 | #28 | Exceptional 60.5% |
| Hawaiians | 100.0 /100 | #29 | Exceptional 60.4% |
| Finns | 100.0 /100 | #30 | Exceptional 60.3% |
Demographics Similar to Immigrants from Austria by 2 or more Vehicles in Household
In terms of 2 or more vehicles in household, the demographic groups most similar to Immigrants from Austria are French American Indian (55.5%, a difference of 0.010%), Romanian (55.5%, a difference of 0.020%), Kenyan (55.5%, a difference of 0.070%), Immigrants from Sri Lanka (55.5%, a difference of 0.080%), and Immigrants from Costa Rica (55.4%, a difference of 0.080%).
| Demographics | Rating | Rank | 2 or more Vehicles in Household |
| German Russians | 60.9 /100 | #162 | Good 55.6% |
| Immigrants | Zimbabwe | 60.2 /100 | #163 | Good 55.6% |
| Dutch West Indians | 59.8 /100 | #164 | Average 55.6% |
| Immigrants | El Salvador | 59.4 /100 | #165 | Average 55.6% |
| Immigrants | Sri Lanka | 58.3 /100 | #166 | Average 55.5% |
| Kenyans | 58.1 /100 | #167 | Average 55.5% |
| French American Indians | 56.7 /100 | #168 | Average 55.5% |
| Immigrants | Austria | 56.3 /100 | #169 | Average 55.5% |
| Romanians | 55.8 /100 | #170 | Average 55.5% |
| Immigrants | Costa Rica | 54.4 /100 | #171 | Average 55.4% |
| Immigrants | Nicaragua | 51.6 /100 | #172 | Average 55.4% |
| Immigrants | Western Europe | 51.4 /100 | #173 | Average 55.4% |
| Navajo | 50.0 /100 | #174 | Average 55.3% |
| Immigrants | Denmark | 49.4 /100 | #175 | Average 55.3% |
| Immigrants | Cuba | 47.0 /100 | #176 | Average 55.3% |