Cheyenne vs Immigrants from Austria 2 or more Vehicles in Household
COMPARE
Cheyenne
Immigrants from Austria
2 or more Vehicles in Household
2 or more Vehicles in Household Comparison
Cheyenne
Immigrants from Austria
54.3%
2 OR MORE VEHICLES IN HOUSEHOLD
13.6/ 100
METRIC RATING
205th/ 347
METRIC RANK
55.5%
2 OR MORE VEHICLES IN HOUSEHOLD
56.3/ 100
METRIC RATING
169th/ 347
METRIC RANK
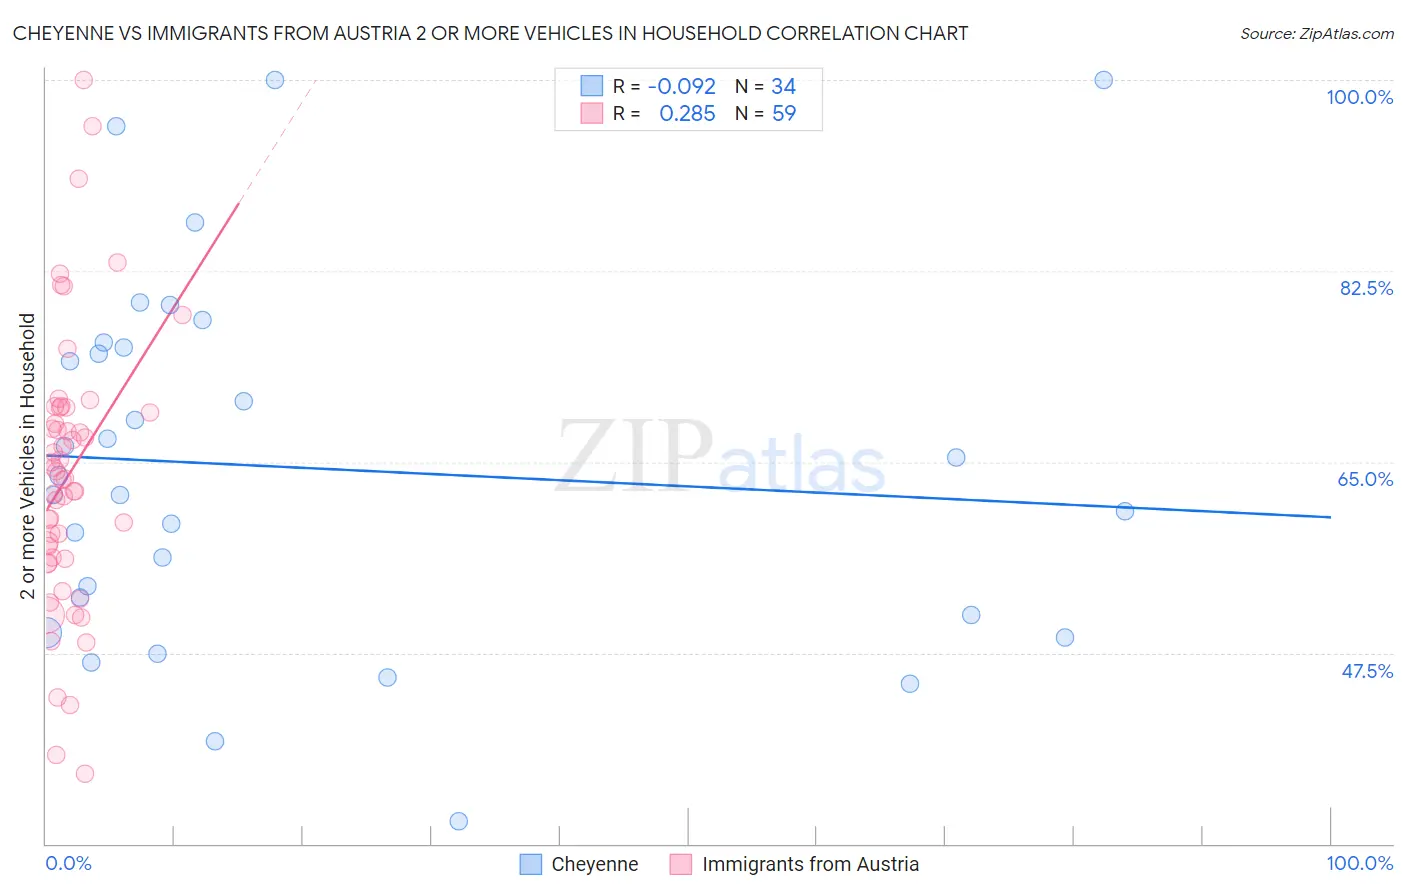
Cheyenne vs Immigrants from Austria 2 or more Vehicles in Household Correlation Chart
The statistical analysis conducted on geographies consisting of 80,710,429 people shows a slight negative correlation between the proportion of Cheyenne and percentage of households with 2 or more vehicles available in the United States with a correlation coefficient (R) of -0.092 and weighted average of 54.3%. Similarly, the statistical analysis conducted on geographies consisting of 167,963,508 people shows a weak positive correlation between the proportion of Immigrants from Austria and percentage of households with 2 or more vehicles available in the United States with a correlation coefficient (R) of 0.285 and weighted average of 55.5%, a difference of 2.1%.
2 or more Vehicles in Household Correlation Summary
| Measurement | Cheyenne | Immigrants from Austria |
| Minimum | 32.0% | 36.4% |
| Maximum | 100.0% | 100.0% |
| Range | 68.0% | 63.6% |
| Mean | 64.5% | 63.8% |
| Median | 62.8% | 63.4% |
| Interquartile 25% (IQ1) | 51.0% | 56.1% |
| Interquartile 75% (IQ3) | 75.5% | 70.0% |
| Interquartile Range (IQR) | 24.5% | 13.9% |
| Standard Deviation (Sample) | 16.8% | 12.6% |
| Standard Deviation (Population) | 16.5% | 12.5% |
Similar Demographics by 2 or more Vehicles in Household
Demographics Similar to Cheyenne by 2 or more Vehicles in Household
In terms of 2 or more vehicles in household, the demographic groups most similar to Cheyenne are Immigrants from Belgium (54.3%, a difference of 0.010%), Immigrants from Latin America (54.3%, a difference of 0.050%), Immigrants from Peru (54.4%, a difference of 0.060%), Turkish (54.3%, a difference of 0.060%), and Immigrants from North Macedonia (54.4%, a difference of 0.10%).
| Demographics | Rating | Rank | 2 or more Vehicles in Household |
| Carpatho Rusyns | 16.2 /100 | #198 | Poor 54.4% |
| Immigrants | Norway | 15.9 /100 | #199 | Poor 54.4% |
| Houma | 15.8 /100 | #200 | Poor 54.4% |
| Immigrants | Italy | 15.5 /100 | #201 | Poor 54.4% |
| Immigrants | North Macedonia | 14.9 /100 | #202 | Poor 54.4% |
| Immigrants | Peru | 14.3 /100 | #203 | Poor 54.4% |
| Immigrants | Belgium | 13.7 /100 | #204 | Poor 54.3% |
| Cheyenne | 13.6 /100 | #205 | Poor 54.3% |
| Immigrants | Latin America | 13.1 /100 | #206 | Poor 54.3% |
| Turks | 13.0 /100 | #207 | Poor 54.3% |
| Egyptians | 12.0 /100 | #208 | Poor 54.3% |
| Immigrants | Bulgaria | 12.0 /100 | #209 | Poor 54.3% |
| Immigrants | Saudi Arabia | 11.3 /100 | #210 | Poor 54.2% |
| Immigrants | Hungary | 11.3 /100 | #211 | Poor 54.2% |
| Immigrants | Chile | 11.1 /100 | #212 | Poor 54.2% |
Demographics Similar to Immigrants from Austria by 2 or more Vehicles in Household
In terms of 2 or more vehicles in household, the demographic groups most similar to Immigrants from Austria are French American Indian (55.5%, a difference of 0.010%), Romanian (55.5%, a difference of 0.020%), Kenyan (55.5%, a difference of 0.070%), Immigrants from Sri Lanka (55.5%, a difference of 0.080%), and Immigrants from Costa Rica (55.4%, a difference of 0.080%).
| Demographics | Rating | Rank | 2 or more Vehicles in Household |
| German Russians | 60.9 /100 | #162 | Good 55.6% |
| Immigrants | Zimbabwe | 60.2 /100 | #163 | Good 55.6% |
| Dutch West Indians | 59.8 /100 | #164 | Average 55.6% |
| Immigrants | El Salvador | 59.4 /100 | #165 | Average 55.6% |
| Immigrants | Sri Lanka | 58.3 /100 | #166 | Average 55.5% |
| Kenyans | 58.1 /100 | #167 | Average 55.5% |
| French American Indians | 56.7 /100 | #168 | Average 55.5% |
| Immigrants | Austria | 56.3 /100 | #169 | Average 55.5% |
| Romanians | 55.8 /100 | #170 | Average 55.5% |
| Immigrants | Costa Rica | 54.4 /100 | #171 | Average 55.4% |
| Immigrants | Nicaragua | 51.6 /100 | #172 | Average 55.4% |
| Immigrants | Western Europe | 51.4 /100 | #173 | Average 55.4% |
| Navajo | 50.0 /100 | #174 | Average 55.3% |
| Immigrants | Denmark | 49.4 /100 | #175 | Average 55.3% |
| Immigrants | Cuba | 47.0 /100 | #176 | Average 55.3% |