Apache vs Ugandan No Vehicles in Household
COMPARE
Apache
Ugandan
No Vehicles in Household
No Vehicles in Household Comparison
Apache
Ugandans
11.0%
NO VEHICLES IN HOUSEHOLD
14.8/ 100
METRIC RATING
210th/ 347
METRIC RANK
11.4%
NO VEHICLES IN HOUSEHOLD
5.3/ 100
METRIC RATING
229th/ 347
METRIC RANK
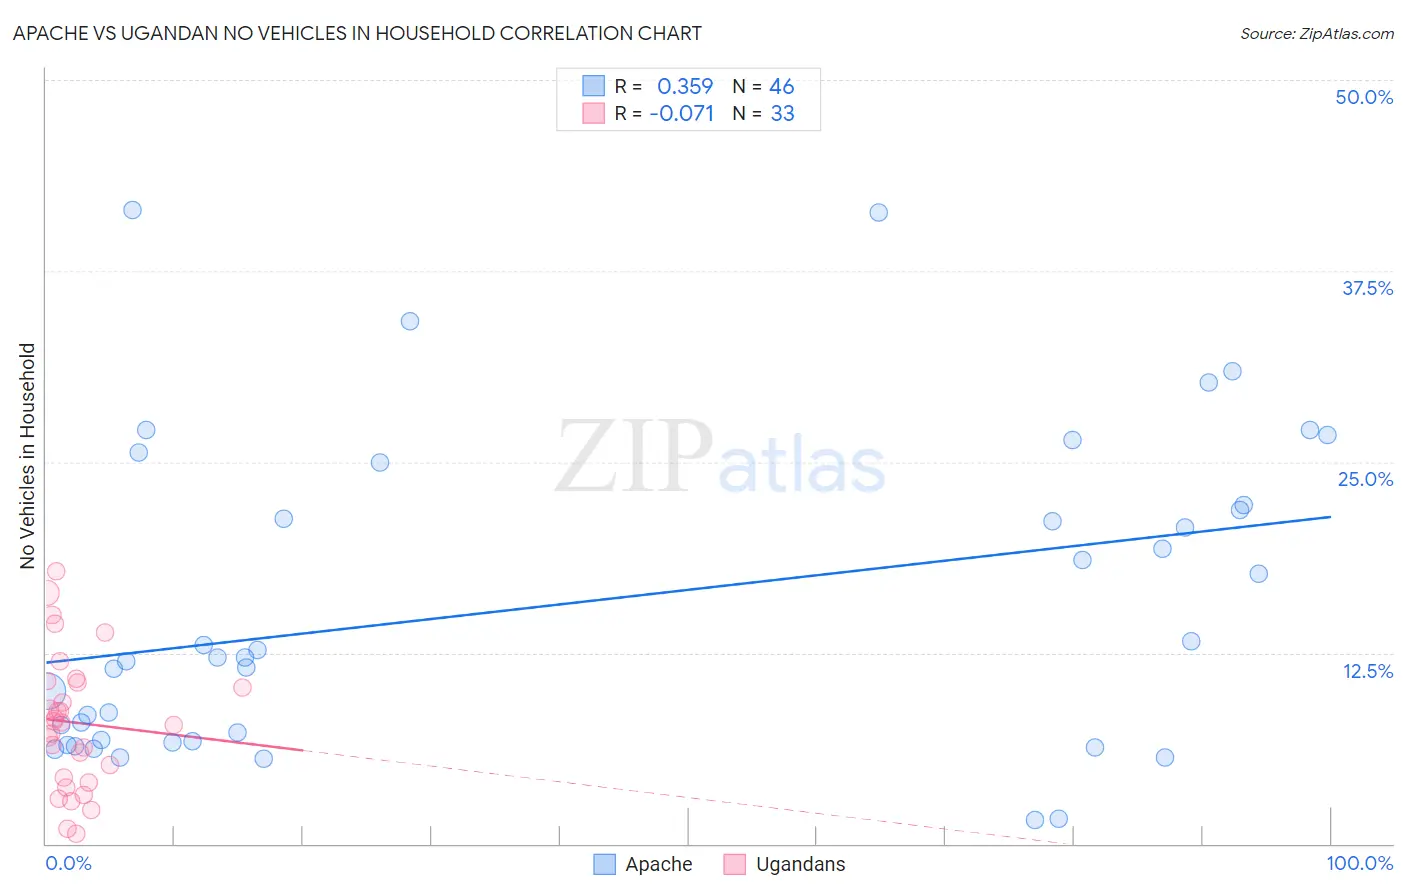
Apache vs Ugandan No Vehicles in Household Correlation Chart
The statistical analysis conducted on geographies consisting of 230,777,431 people shows a mild positive correlation between the proportion of Apache and percentage of households with no vehicle available in the United States with a correlation coefficient (R) of 0.359 and weighted average of 11.0%. Similarly, the statistical analysis conducted on geographies consisting of 93,973,141 people shows a slight negative correlation between the proportion of Ugandans and percentage of households with no vehicle available in the United States with a correlation coefficient (R) of -0.071 and weighted average of 11.4%, a difference of 3.6%.
No Vehicles in Household Correlation Summary
| Measurement | Apache | Ugandan |
| Minimum | 1.5% | 0.63% |
| Maximum | 41.5% | 17.9% |
| Range | 40.0% | 17.2% |
| Mean | 15.6% | 7.9% |
| Median | 12.2% | 8.0% |
| Interquartile 25% (IQ1) | 6.7% | 4.2% |
| Interquartile 75% (IQ3) | 22.2% | 10.6% |
| Interquartile Range (IQR) | 15.5% | 6.4% |
| Standard Deviation (Sample) | 10.3% | 4.4% |
| Standard Deviation (Population) | 10.2% | 4.3% |
Demographics Similar to Apache and Ugandans by No Vehicles in Household
In terms of no vehicles in household, the demographic groups most similar to Apache are Pennsylvania German (11.0%, a difference of 0.16%), Crow (11.0%, a difference of 0.16%), Immigrants from Western Asia (11.0%, a difference of 0.25%), Immigrants from Hungary (11.1%, a difference of 0.69%), and Immigrants from Denmark (11.1%, a difference of 0.76%). Similarly, the demographic groups most similar to Ugandans are Immigrants from Romania (11.4%, a difference of 0.040%), Immigrants from Pakistan (11.4%, a difference of 0.080%), Immigrants from Somalia (11.4%, a difference of 0.10%), Immigrants from Sierra Leone (11.3%, a difference of 0.66%), and Immigrants from Hong Kong (11.3%, a difference of 1.0%).
| Demographics | Rating | Rank | No Vehicles in Household |
| Pennsylvania Germans | 15.5 /100 | #209 | Poor 11.0% |
| Apache | 14.8 /100 | #210 | Poor 11.0% |
| Crow | 14.2 /100 | #211 | Poor 11.0% |
| Immigrants | Western Asia | 13.9 /100 | #212 | Poor 11.0% |
| Immigrants | Hungary | 12.3 /100 | #213 | Poor 11.1% |
| Immigrants | Denmark | 12.1 /100 | #214 | Poor 11.1% |
| Immigrants | Sri Lanka | 10.6 /100 | #215 | Poor 11.2% |
| Immigrants | Argentina | 10.6 /100 | #216 | Poor 11.2% |
| Dutch West Indians | 10.2 /100 | #217 | Poor 11.2% |
| Immigrants | Guatemala | 10.0 /100 | #218 | Tragic 11.2% |
| Argentineans | 9.6 /100 | #219 | Tragic 11.2% |
| Immigrants | Zaire | 9.6 /100 | #220 | Tragic 11.2% |
| Peruvians | 8.4 /100 | #221 | Tragic 11.2% |
| Immigrants | South America | 8.0 /100 | #222 | Tragic 11.3% |
| Uruguayans | 7.7 /100 | #223 | Tragic 11.3% |
| Immigrants | Hong Kong | 7.2 /100 | #224 | Tragic 11.3% |
| Immigrants | Sierra Leone | 6.4 /100 | #225 | Tragic 11.3% |
| Immigrants | Somalia | 5.4 /100 | #226 | Tragic 11.4% |
| Immigrants | Pakistan | 5.4 /100 | #227 | Tragic 11.4% |
| Immigrants | Romania | 5.3 /100 | #228 | Tragic 11.4% |
| Ugandans | 5.3 /100 | #229 | Tragic 11.4% |