Immigrants from Burma/Myanmar vs Ugandan Child Poverty Under the Age of 5
COMPARE
Immigrants from Burma/Myanmar
Ugandan
Child Poverty Under the Age of 5
Child Poverty Under the Age of 5 Comparison
Immigrants from Burma/Myanmar
Ugandans
20.4%
CHILD POVERTY UNDER THE AGE OF 5
0.1/ 100
METRIC RATING
269th/ 347
METRIC RANK
18.0%
CHILD POVERTY UNDER THE AGE OF 5
13.9/ 100
METRIC RATING
201st/ 347
METRIC RANK
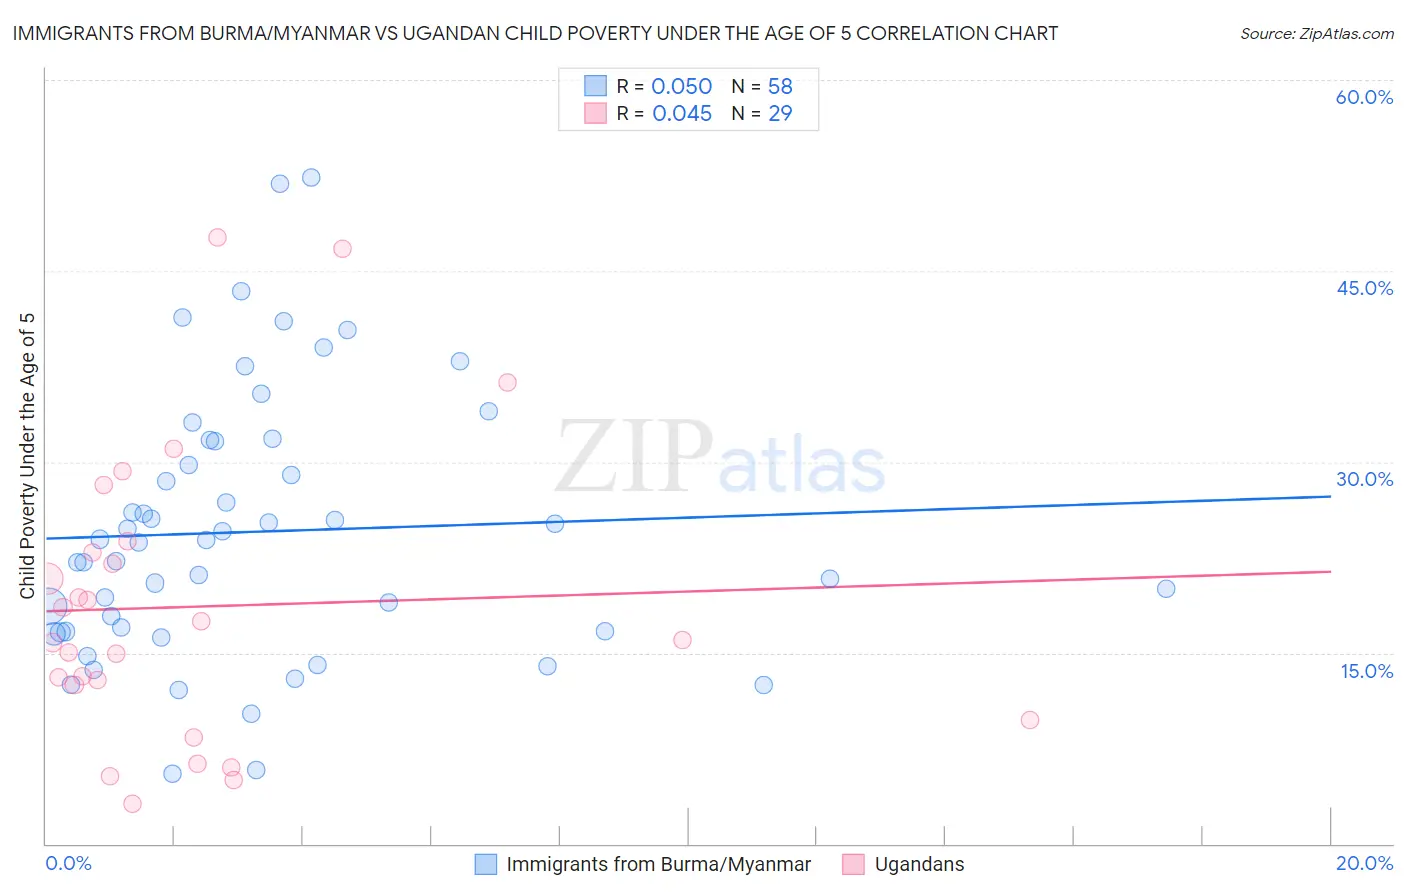
Immigrants from Burma/Myanmar vs Ugandan Child Poverty Under the Age of 5 Correlation Chart
The statistical analysis conducted on geographies consisting of 169,386,512 people shows a slight positive correlation between the proportion of Immigrants from Burma/Myanmar and poverty level among children under the age of 5 in the United States with a correlation coefficient (R) of 0.050 and weighted average of 20.4%. Similarly, the statistical analysis conducted on geographies consisting of 92,908,510 people shows no correlation between the proportion of Ugandans and poverty level among children under the age of 5 in the United States with a correlation coefficient (R) of 0.045 and weighted average of 18.0%, a difference of 12.8%.
Child Poverty Under the Age of 5 Correlation Summary
| Measurement | Immigrants from Burma/Myanmar | Ugandan |
| Minimum | 5.5% | 3.2% |
| Maximum | 52.3% | 47.7% |
| Range | 46.9% | 44.5% |
| Mean | 24.5% | 18.6% |
| Median | 23.8% | 16.0% |
| Interquartile 25% (IQ1) | 16.7% | 11.1% |
| Interquartile 75% (IQ3) | 31.6% | 23.3% |
| Interquartile Range (IQR) | 15.0% | 12.2% |
| Standard Deviation (Sample) | 10.5% | 11.4% |
| Standard Deviation (Population) | 10.4% | 11.2% |
Similar Demographics by Child Poverty Under the Age of 5
Demographics Similar to Immigrants from Burma/Myanmar by Child Poverty Under the Age of 5
In terms of child poverty under the age of 5, the demographic groups most similar to Immigrants from Burma/Myanmar are Jamaican (20.4%, a difference of 0.070%), Ottawa (20.3%, a difference of 0.090%), Belizean (20.3%, a difference of 0.090%), Aleut (20.3%, a difference of 0.48%), and American (20.5%, a difference of 0.52%).
| Demographics | Rating | Rank | Child Poverty Under the Age of 5 |
| Liberians | 0.1 /100 | #262 | Tragic 20.2% |
| Barbadians | 0.1 /100 | #263 | Tragic 20.2% |
| Immigrants | Liberia | 0.1 /100 | #264 | Tragic 20.2% |
| Spanish American Indians | 0.1 /100 | #265 | Tragic 20.2% |
| Aleuts | 0.1 /100 | #266 | Tragic 20.3% |
| Ottawa | 0.1 /100 | #267 | Tragic 20.3% |
| Belizeans | 0.1 /100 | #268 | Tragic 20.3% |
| Immigrants | Burma/Myanmar | 0.1 /100 | #269 | Tragic 20.4% |
| Jamaicans | 0.1 /100 | #270 | Tragic 20.4% |
| Americans | 0.1 /100 | #271 | Tragic 20.5% |
| Immigrants | Jamaica | 0.1 /100 | #272 | Tragic 20.5% |
| Central Americans | 0.1 /100 | #273 | Tragic 20.6% |
| Immigrants | Belize | 0.1 /100 | #274 | Tragic 20.6% |
| Bangladeshis | 0.1 /100 | #275 | Tragic 20.6% |
| West Indians | 0.0 /100 | #276 | Tragic 20.6% |
Demographics Similar to Ugandans by Child Poverty Under the Age of 5
In terms of child poverty under the age of 5, the demographic groups most similar to Ugandans are Iraqi (18.0%, a difference of 0.010%), Japanese (18.1%, a difference of 0.020%), Immigrants from Cambodia (18.1%, a difference of 0.040%), Immigrants from Eastern Africa (18.1%, a difference of 0.090%), and Spaniard (18.1%, a difference of 0.22%).
| Demographics | Rating | Rank | Child Poverty Under the Age of 5 |
| French Canadians | 24.6 /100 | #194 | Fair 17.7% |
| Sierra Leoneans | 24.1 /100 | #195 | Fair 17.7% |
| Immigrants | Portugal | 22.2 /100 | #196 | Fair 17.8% |
| Immigrants | Kenya | 20.0 /100 | #197 | Fair 17.9% |
| Celtics | 18.3 /100 | #198 | Poor 17.9% |
| Hungarians | 18.3 /100 | #199 | Poor 17.9% |
| Iraqis | 14.0 /100 | #200 | Poor 18.0% |
| Ugandans | 13.9 /100 | #201 | Poor 18.0% |
| Japanese | 13.8 /100 | #202 | Poor 18.1% |
| Immigrants | Cambodia | 13.7 /100 | #203 | Poor 18.1% |
| Immigrants | Eastern Africa | 13.4 /100 | #204 | Poor 18.1% |
| Spaniards | 12.8 /100 | #205 | Poor 18.1% |
| Whites/Caucasians | 12.6 /100 | #206 | Poor 18.1% |
| Immigrants | Immigrants | 9.9 /100 | #207 | Tragic 18.2% |
| Scotch-Irish | 9.8 /100 | #208 | Tragic 18.2% |