Immigrants from Burma/Myanmar vs Immigrants from Switzerland 9th Grade
COMPARE
Immigrants from Burma/Myanmar
Immigrants from Switzerland
9th Grade
9th Grade Comparison
Immigrants from Burma/Myanmar
Immigrants from Switzerland
93.1%
9TH GRADE
0.0/ 100
METRIC RATING
295th/ 347
METRIC RANK
95.5%
9TH GRADE
97.7/ 100
METRIC RATING
102nd/ 347
METRIC RANK
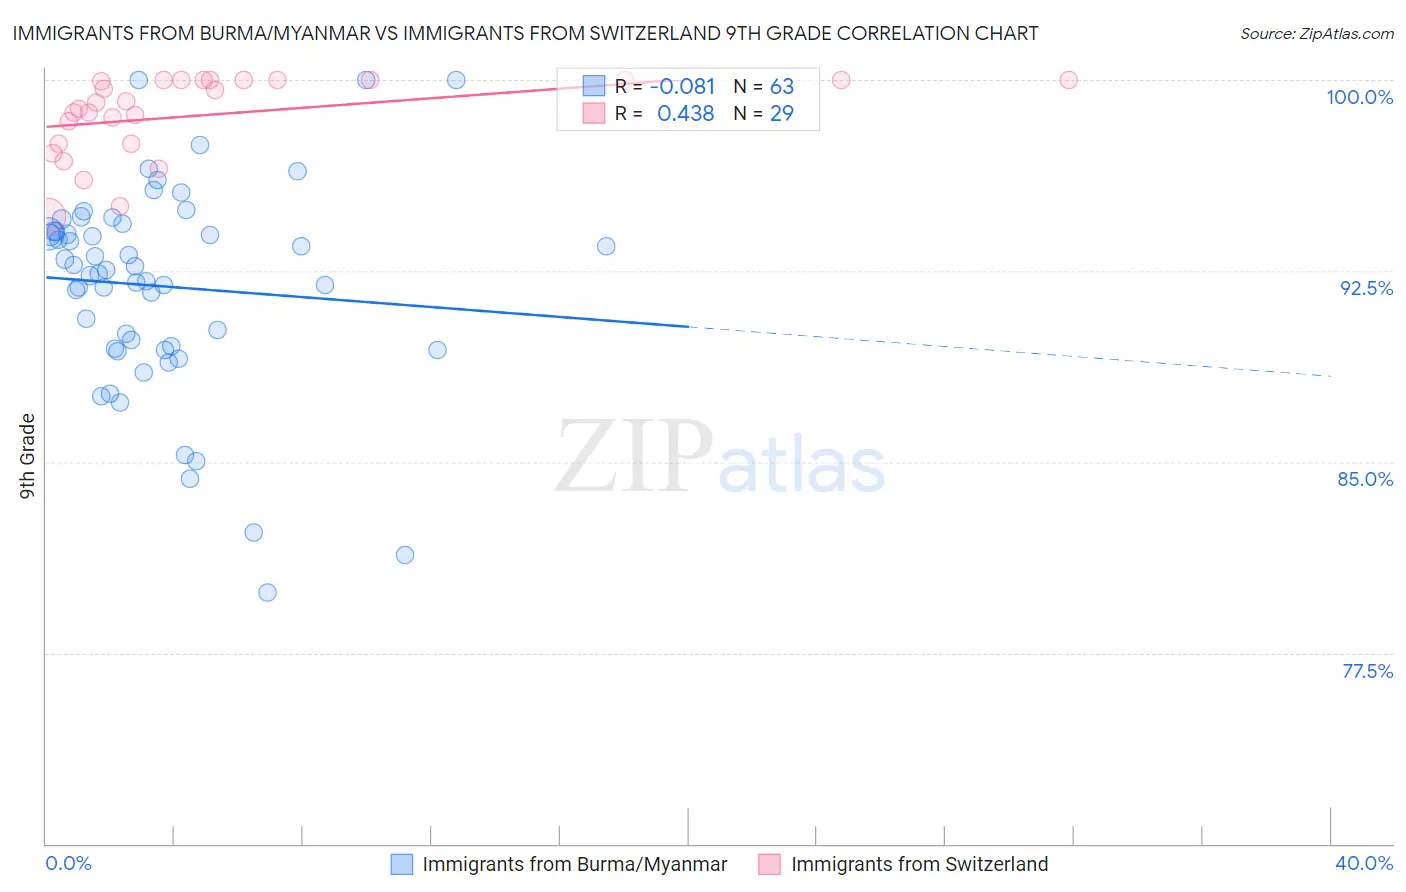
Immigrants from Burma/Myanmar vs Immigrants from Switzerland 9th Grade Correlation Chart
The statistical analysis conducted on geographies consisting of 172,345,696 people shows a slight negative correlation between the proportion of Immigrants from Burma/Myanmar and percentage of population with at least 9th grade education in the United States with a correlation coefficient (R) of -0.081 and weighted average of 93.1%. Similarly, the statistical analysis conducted on geographies consisting of 148,082,451 people shows a moderate positive correlation between the proportion of Immigrants from Switzerland and percentage of population with at least 9th grade education in the United States with a correlation coefficient (R) of 0.438 and weighted average of 95.5%, a difference of 2.6%.
9th Grade Correlation Summary
| Measurement | Immigrants from Burma/Myanmar | Immigrants from Switzerland |
| Minimum | 79.9% | 94.6% |
| Maximum | 100.0% | 100.0% |
| Range | 20.1% | 5.4% |
| Mean | 91.9% | 98.6% |
| Median | 92.5% | 99.1% |
| Interquartile 25% (IQ1) | 89.4% | 97.5% |
| Interquartile 75% (IQ3) | 94.1% | 100.0% |
| Interquartile Range (IQR) | 4.6% | 2.5% |
| Standard Deviation (Sample) | 4.1% | 1.6% |
| Standard Deviation (Population) | 4.1% | 1.6% |
Similar Demographics by 9th Grade
Demographics Similar to Immigrants from Burma/Myanmar by 9th Grade
In terms of 9th grade, the demographic groups most similar to Immigrants from Burma/Myanmar are Indonesian (93.1%, a difference of 0.0%), Sri Lankan (93.2%, a difference of 0.020%), Cuban (93.2%, a difference of 0.020%), Fijian (93.1%, a difference of 0.030%), and Immigrants from Laos (93.2%, a difference of 0.040%).
| Demographics | Rating | Rank | 9th Grade |
| Immigrants | South Eastern Asia | 0.0 /100 | #288 | Tragic 93.3% |
| Immigrants | West Indies | 0.0 /100 | #289 | Tragic 93.3% |
| Pennsylvania Germans | 0.0 /100 | #290 | Tragic 93.3% |
| British West Indians | 0.0 /100 | #291 | Tragic 93.2% |
| Immigrants | Laos | 0.0 /100 | #292 | Tragic 93.2% |
| Sri Lankans | 0.0 /100 | #293 | Tragic 93.2% |
| Cubans | 0.0 /100 | #294 | Tragic 93.2% |
| Immigrants | Burma/Myanmar | 0.0 /100 | #295 | Tragic 93.1% |
| Indonesians | 0.0 /100 | #296 | Tragic 93.1% |
| Fijians | 0.0 /100 | #297 | Tragic 93.1% |
| Haitians | 0.0 /100 | #298 | Tragic 93.1% |
| Immigrants | Grenada | 0.0 /100 | #299 | Tragic 93.0% |
| Yaqui | 0.0 /100 | #300 | Tragic 92.9% |
| Immigrants | Haiti | 0.0 /100 | #301 | Tragic 92.7% |
| Immigrants | Dominica | 0.0 /100 | #302 | Tragic 92.7% |
Demographics Similar to Immigrants from Switzerland by 9th Grade
In terms of 9th grade, the demographic groups most similar to Immigrants from Switzerland are Potawatomi (95.5%, a difference of 0.0%), Immigrants from Moldova (95.5%, a difference of 0.010%), Syrian (95.5%, a difference of 0.030%), Immigrants from France (95.5%, a difference of 0.030%), and Lebanese (95.6%, a difference of 0.040%).
| Demographics | Rating | Rank | 9th Grade |
| Americans | 98.5 /100 | #95 | Exceptional 95.6% |
| Filipinos | 98.5 /100 | #96 | Exceptional 95.6% |
| Delaware | 98.4 /100 | #97 | Exceptional 95.6% |
| Immigrants | Japan | 98.4 /100 | #98 | Exceptional 95.6% |
| Menominee | 98.3 /100 | #99 | Exceptional 95.6% |
| Lebanese | 98.1 /100 | #100 | Exceptional 95.6% |
| Immigrants | Moldova | 97.9 /100 | #101 | Exceptional 95.5% |
| Immigrants | Switzerland | 97.7 /100 | #102 | Exceptional 95.5% |
| Potawatomi | 97.7 /100 | #103 | Exceptional 95.5% |
| Syrians | 97.4 /100 | #104 | Exceptional 95.5% |
| Immigrants | France | 97.4 /100 | #105 | Exceptional 95.5% |
| Immigrants | Norway | 97.1 /100 | #106 | Exceptional 95.5% |
| Immigrants | Zimbabwe | 96.9 /100 | #107 | Exceptional 95.5% |
| Chickasaw | 96.8 /100 | #108 | Exceptional 95.5% |
| Osage | 96.8 /100 | #109 | Exceptional 95.5% |