Immigrants from Burma/Myanmar vs Dutch West Indian Single Father Households
COMPARE
Immigrants from Burma/Myanmar
Dutch West Indian
Single Father Households
Single Father Households Comparison
Immigrants from Burma/Myanmar
Dutch West Indians
2.4%
SINGLE FATHER HOUSEHOLDS
12.1/ 100
METRIC RATING
221st/ 347
METRIC RANK
2.6%
SINGLE FATHER HOUSEHOLDS
0.1/ 100
METRIC RATING
282nd/ 347
METRIC RANK
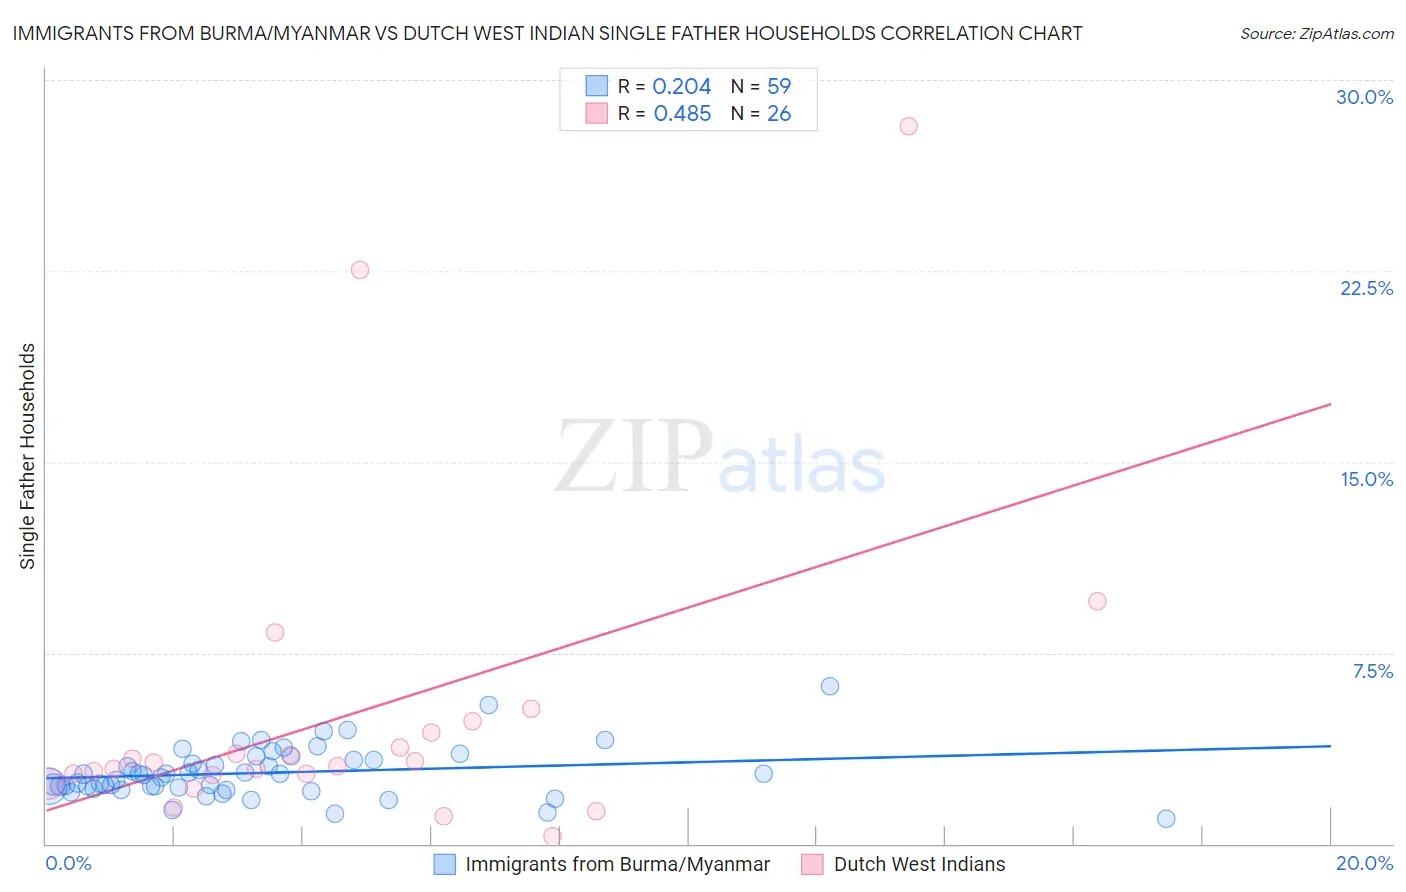
Immigrants from Burma/Myanmar vs Dutch West Indian Single Father Households Correlation Chart
The statistical analysis conducted on geographies consisting of 171,785,459 people shows a weak positive correlation between the proportion of Immigrants from Burma/Myanmar and percentage of single father households in the United States with a correlation coefficient (R) of 0.204 and weighted average of 2.4%. Similarly, the statistical analysis conducted on geographies consisting of 85,485,397 people shows a moderate positive correlation between the proportion of Dutch West Indians and percentage of single father households in the United States with a correlation coefficient (R) of 0.485 and weighted average of 2.6%, a difference of 8.9%.
Single Father Households Correlation Summary
| Measurement | Immigrants from Burma/Myanmar | Dutch West Indian |
| Minimum | 0.98% | 0.30% |
| Maximum | 6.2% | 28.2% |
| Range | 5.2% | 27.9% |
| Mean | 2.8% | 5.1% |
| Median | 2.7% | 3.1% |
| Interquartile 25% (IQ1) | 2.2% | 2.7% |
| Interquartile 75% (IQ3) | 3.3% | 4.4% |
| Interquartile Range (IQR) | 1.1% | 1.6% |
| Standard Deviation (Sample) | 0.98% | 6.3% |
| Standard Deviation (Population) | 0.97% | 6.2% |
Similar Demographics by Single Father Households
Demographics Similar to Immigrants from Burma/Myanmar by Single Father Households
In terms of single father households, the demographic groups most similar to Immigrants from Burma/Myanmar are Immigrants from Eastern Africa (2.4%, a difference of 0.030%), Ghanaian (2.4%, a difference of 0.13%), Sudanese (2.4%, a difference of 0.14%), Immigrants from Uruguay (2.4%, a difference of 0.19%), and Immigrants from Ethiopia (2.4%, a difference of 0.21%).
| Demographics | Rating | Rank | Single Father Households |
| Ethiopians | 16.6 /100 | #214 | Poor 2.4% |
| Immigrants | South Eastern Asia | 15.9 /100 | #215 | Poor 2.4% |
| Immigrants | Ecuador | 14.9 /100 | #216 | Poor 2.4% |
| Dutch | 14.3 /100 | #217 | Poor 2.4% |
| Immigrants | Ethiopia | 13.4 /100 | #218 | Poor 2.4% |
| Sudanese | 13.0 /100 | #219 | Poor 2.4% |
| Ghanaians | 12.9 /100 | #220 | Poor 2.4% |
| Immigrants | Burma/Myanmar | 12.1 /100 | #221 | Poor 2.4% |
| Immigrants | Eastern Africa | 11.9 /100 | #222 | Poor 2.4% |
| Immigrants | Uruguay | 11.0 /100 | #223 | Poor 2.4% |
| Immigrants | Bahamas | 10.6 /100 | #224 | Poor 2.4% |
| Marshallese | 9.7 /100 | #225 | Tragic 2.4% |
| Blacks/African Americans | 9.7 /100 | #226 | Tragic 2.4% |
| Americans | 9.3 /100 | #227 | Tragic 2.4% |
| Immigrants | Ghana | 9.1 /100 | #228 | Tragic 2.4% |
Demographics Similar to Dutch West Indians by Single Father Households
In terms of single father households, the demographic groups most similar to Dutch West Indians are Nicaraguan (2.6%, a difference of 0.050%), Immigrants from Portugal (2.6%, a difference of 0.060%), Samoan (2.6%, a difference of 0.61%), Cherokee (2.6%, a difference of 0.65%), and Immigrants from Nicaragua (2.7%, a difference of 0.69%).
| Demographics | Rating | Rank | Single Father Households |
| Immigrants | Dominican Republic | 0.2 /100 | #275 | Tragic 2.6% |
| Immigrants | Haiti | 0.1 /100 | #276 | Tragic 2.6% |
| Shoshone | 0.1 /100 | #277 | Tragic 2.6% |
| Cherokee | 0.1 /100 | #278 | Tragic 2.6% |
| Samoans | 0.1 /100 | #279 | Tragic 2.6% |
| Immigrants | Portugal | 0.1 /100 | #280 | Tragic 2.6% |
| Nicaraguans | 0.1 /100 | #281 | Tragic 2.6% |
| Dutch West Indians | 0.1 /100 | #282 | Tragic 2.6% |
| Immigrants | Nicaragua | 0.1 /100 | #283 | Tragic 2.7% |
| Hawaiians | 0.1 /100 | #284 | Tragic 2.7% |
| Ottawa | 0.1 /100 | #285 | Tragic 2.7% |
| Immigrants | Cuba | 0.1 /100 | #286 | Tragic 2.7% |
| Central American Indians | 0.0 /100 | #287 | Tragic 2.7% |
| Immigrants | Cambodia | 0.0 /100 | #288 | Tragic 2.7% |
| Tlingit-Haida | 0.0 /100 | #289 | Tragic 2.7% |