Immigrants from Burma/Myanmar vs Cheyenne Child Poverty Under the Age of 5
COMPARE
Immigrants from Burma/Myanmar
Cheyenne
Child Poverty Under the Age of 5
Child Poverty Under the Age of 5 Comparison
Immigrants from Burma/Myanmar
Cheyenne
20.4%
CHILD POVERTY UNDER THE AGE OF 5
0.1/ 100
METRIC RATING
269th/ 347
METRIC RANK
28.3%
CHILD POVERTY UNDER THE AGE OF 5
0.0/ 100
METRIC RATING
340th/ 347
METRIC RANK
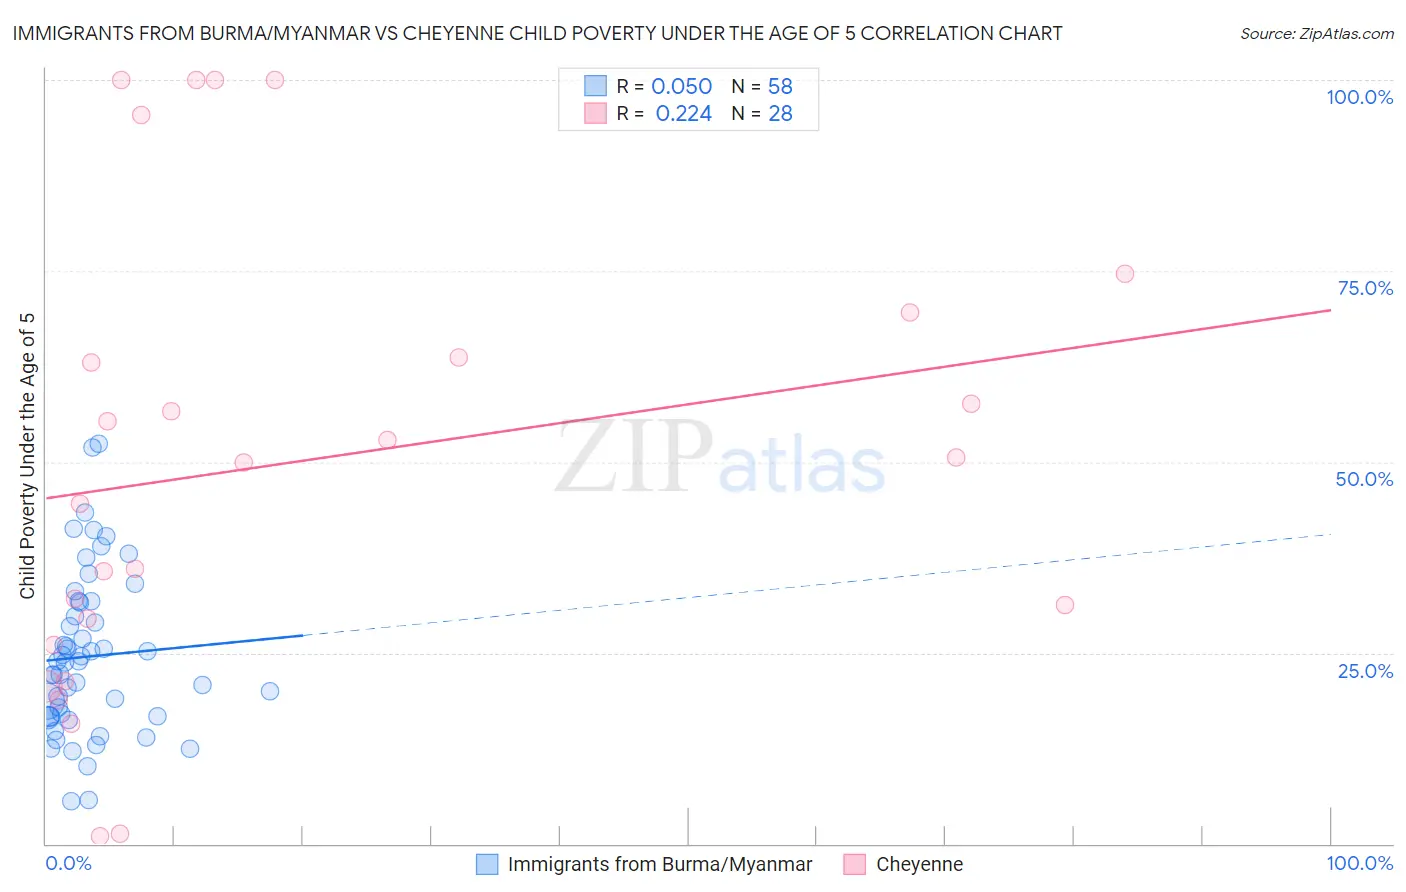
Immigrants from Burma/Myanmar vs Cheyenne Child Poverty Under the Age of 5 Correlation Chart
The statistical analysis conducted on geographies consisting of 169,386,512 people shows a slight positive correlation between the proportion of Immigrants from Burma/Myanmar and poverty level among children under the age of 5 in the United States with a correlation coefficient (R) of 0.050 and weighted average of 20.4%. Similarly, the statistical analysis conducted on geographies consisting of 80,047,765 people shows a weak positive correlation between the proportion of Cheyenne and poverty level among children under the age of 5 in the United States with a correlation coefficient (R) of 0.224 and weighted average of 28.3%, a difference of 39.2%.
Child Poverty Under the Age of 5 Correlation Summary
| Measurement | Immigrants from Burma/Myanmar | Cheyenne |
| Minimum | 5.5% | 1.0% |
| Maximum | 52.3% | 100.0% |
| Range | 46.9% | 99.0% |
| Mean | 24.5% | 50.1% |
| Median | 23.8% | 50.3% |
| Interquartile 25% (IQ1) | 16.7% | 27.8% |
| Interquartile 75% (IQ3) | 31.6% | 66.6% |
| Interquartile Range (IQR) | 15.0% | 38.9% |
| Standard Deviation (Sample) | 10.5% | 30.0% |
| Standard Deviation (Population) | 10.4% | 29.4% |
Similar Demographics by Child Poverty Under the Age of 5
Demographics Similar to Immigrants from Burma/Myanmar by Child Poverty Under the Age of 5
In terms of child poverty under the age of 5, the demographic groups most similar to Immigrants from Burma/Myanmar are Jamaican (20.4%, a difference of 0.070%), Ottawa (20.3%, a difference of 0.090%), Belizean (20.3%, a difference of 0.090%), Aleut (20.3%, a difference of 0.48%), and American (20.5%, a difference of 0.52%).
| Demographics | Rating | Rank | Child Poverty Under the Age of 5 |
| Liberians | 0.1 /100 | #262 | Tragic 20.2% |
| Barbadians | 0.1 /100 | #263 | Tragic 20.2% |
| Immigrants | Liberia | 0.1 /100 | #264 | Tragic 20.2% |
| Spanish American Indians | 0.1 /100 | #265 | Tragic 20.2% |
| Aleuts | 0.1 /100 | #266 | Tragic 20.3% |
| Ottawa | 0.1 /100 | #267 | Tragic 20.3% |
| Belizeans | 0.1 /100 | #268 | Tragic 20.3% |
| Immigrants | Burma/Myanmar | 0.1 /100 | #269 | Tragic 20.4% |
| Jamaicans | 0.1 /100 | #270 | Tragic 20.4% |
| Americans | 0.1 /100 | #271 | Tragic 20.5% |
| Immigrants | Jamaica | 0.1 /100 | #272 | Tragic 20.5% |
| Central Americans | 0.1 /100 | #273 | Tragic 20.6% |
| Immigrants | Belize | 0.1 /100 | #274 | Tragic 20.6% |
| Bangladeshis | 0.1 /100 | #275 | Tragic 20.6% |
| West Indians | 0.0 /100 | #276 | Tragic 20.6% |
Demographics Similar to Cheyenne by Child Poverty Under the Age of 5
In terms of child poverty under the age of 5, the demographic groups most similar to Cheyenne are Yup'ik (27.7%, a difference of 2.2%), Hopi (27.7%, a difference of 2.3%), Pima (27.4%, a difference of 3.3%), Immigrants from Yemen (29.3%, a difference of 3.4%), and Tohono O'odham (29.5%, a difference of 4.1%).
| Demographics | Rating | Rank | Child Poverty Under the Age of 5 |
| Natives/Alaskans | 0.0 /100 | #333 | Tragic 25.6% |
| Blacks/African Americans | 0.0 /100 | #334 | Tragic 25.7% |
| Colville | 0.0 /100 | #335 | Tragic 25.7% |
| Sioux | 0.0 /100 | #336 | Tragic 26.9% |
| Pima | 0.0 /100 | #337 | Tragic 27.4% |
| Hopi | 0.0 /100 | #338 | Tragic 27.7% |
| Yup'ik | 0.0 /100 | #339 | Tragic 27.7% |
| Cheyenne | 0.0 /100 | #340 | Tragic 28.3% |
| Immigrants | Yemen | 0.0 /100 | #341 | Tragic 29.3% |
| Tohono O'odham | 0.0 /100 | #342 | Tragic 29.5% |
| Yuman | 0.0 /100 | #343 | Tragic 29.5% |
| Crow | 0.0 /100 | #344 | Tragic 31.0% |
| Navajo | 0.0 /100 | #345 | Tragic 31.6% |
| Lumbee | 0.0 /100 | #346 | Tragic 33.3% |
| Puerto Ricans | 0.0 /100 | #347 | Tragic 34.5% |