Hispanic or Latino vs Menominee 3 or more Vehicles in Household
COMPARE
Hispanic or Latino
Menominee
3 or more Vehicles in Household
3 or more Vehicles in Household Comparison
Hispanics or Latinos
Menominee
22.4%
3 OR MORE VEHICLES IN HOUSEHOLD
100.0/ 100
METRIC RATING
56th/ 347
METRIC RANK
17.2%
3 OR MORE VEHICLES IN HOUSEHOLD
0.2/ 100
METRIC RATING
286th/ 347
METRIC RANK
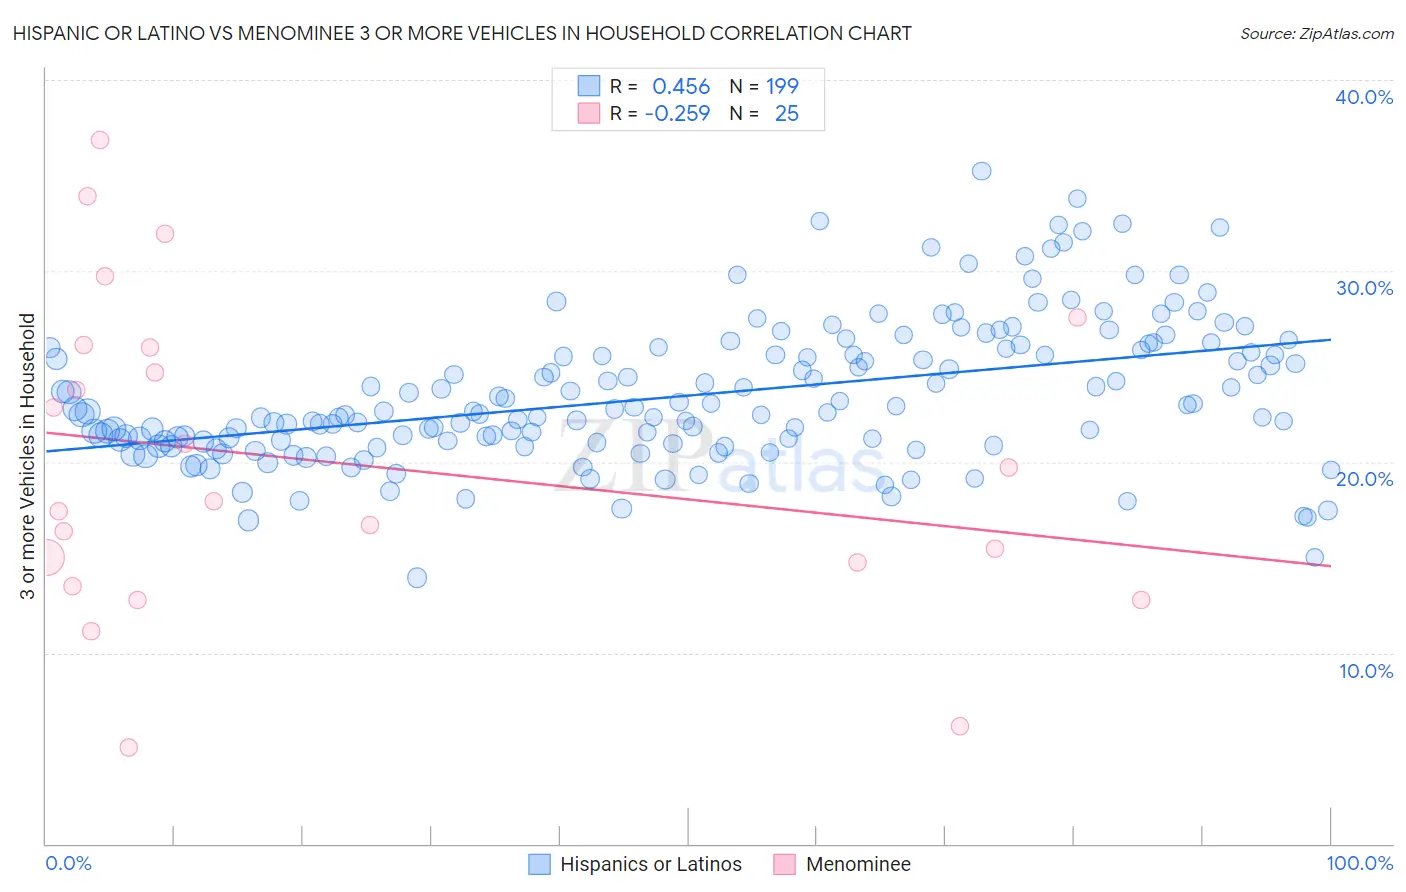
Hispanic or Latino vs Menominee 3 or more Vehicles in Household Correlation Chart
The statistical analysis conducted on geographies consisting of 563,449,459 people shows a moderate positive correlation between the proportion of Hispanics or Latinos and percentage of households with 3 or more vehicles available in the United States with a correlation coefficient (R) of 0.456 and weighted average of 22.4%. Similarly, the statistical analysis conducted on geographies consisting of 45,777,699 people shows a weak negative correlation between the proportion of Menominee and percentage of households with 3 or more vehicles available in the United States with a correlation coefficient (R) of -0.259 and weighted average of 17.2%, a difference of 30.3%.
3 or more Vehicles in Household Correlation Summary
| Measurement | Hispanic or Latino | Menominee |
| Minimum | 13.9% | 5.1% |
| Maximum | 35.2% | 36.9% |
| Range | 21.3% | 31.8% |
| Mean | 23.5% | 20.0% |
| Median | 22.6% | 18.0% |
| Interquartile 25% (IQ1) | 21.1% | 14.1% |
| Interquartile 75% (IQ3) | 25.8% | 26.1% |
| Interquartile Range (IQR) | 4.8% | 12.0% |
| Standard Deviation (Sample) | 3.7% | 8.3% |
| Standard Deviation (Population) | 3.7% | 8.1% |
Similar Demographics by 3 or more Vehicles in Household
Demographics Similar to Hispanics or Latinos by 3 or more Vehicles in Household
In terms of 3 or more vehicles in household, the demographic groups most similar to Hispanics or Latinos are Immigrants from Laos (22.4%, a difference of 0.030%), Pennsylvania German (22.3%, a difference of 0.16%), Spaniard (22.3%, a difference of 0.29%), Navajo (22.3%, a difference of 0.35%), and Crow (22.5%, a difference of 0.40%).
| Demographics | Rating | Rank | 3 or more Vehicles in Household |
| Scotch-Irish | 100.0 /100 | #49 | Exceptional 22.6% |
| Sioux | 100.0 /100 | #50 | Exceptional 22.6% |
| Whites/Caucasians | 100.0 /100 | #51 | Exceptional 22.6% |
| Welsh | 100.0 /100 | #52 | Exceptional 22.6% |
| Czechs | 100.0 /100 | #53 | Exceptional 22.5% |
| Crow | 100.0 /100 | #54 | Exceptional 22.5% |
| Immigrants | Laos | 100.0 /100 | #55 | Exceptional 22.4% |
| Hispanics or Latinos | 100.0 /100 | #56 | Exceptional 22.4% |
| Pennsylvania Germans | 100.0 /100 | #57 | Exceptional 22.3% |
| Spaniards | 100.0 /100 | #58 | Exceptional 22.3% |
| Navajo | 100.0 /100 | #59 | Exceptional 22.3% |
| Finns | 99.9 /100 | #60 | Exceptional 22.3% |
| Bhutanese | 99.9 /100 | #61 | Exceptional 22.2% |
| Fijians | 99.9 /100 | #62 | Exceptional 22.2% |
| Chickasaw | 99.9 /100 | #63 | Exceptional 22.2% |
Demographics Similar to Menominee by 3 or more Vehicles in Household
In terms of 3 or more vehicles in household, the demographic groups most similar to Menominee are Immigrants from Croatia (17.2%, a difference of 0.060%), Immigrants from Brazil (17.1%, a difference of 0.30%), Immigrants from Uruguay (17.1%, a difference of 0.39%), Immigrants from Liberia (17.1%, a difference of 0.46%), and Immigrants from Colombia (17.3%, a difference of 0.79%).
| Demographics | Rating | Rank | 3 or more Vehicles in Household |
| Immigrants | Kazakhstan | 0.3 /100 | #279 | Tragic 17.4% |
| Immigrants | Eastern Europe | 0.3 /100 | #280 | Tragic 17.4% |
| Immigrants | Latvia | 0.3 /100 | #281 | Tragic 17.4% |
| Immigrants | Ireland | 0.3 /100 | #282 | Tragic 17.3% |
| Blacks/African Americans | 0.3 /100 | #283 | Tragic 17.3% |
| Immigrants | Colombia | 0.3 /100 | #284 | Tragic 17.3% |
| Immigrants | Croatia | 0.2 /100 | #285 | Tragic 17.2% |
| Menominee | 0.2 /100 | #286 | Tragic 17.2% |
| Immigrants | Brazil | 0.2 /100 | #287 | Tragic 17.1% |
| Immigrants | Uruguay | 0.2 /100 | #288 | Tragic 17.1% |
| Immigrants | Liberia | 0.1 /100 | #289 | Tragic 17.1% |
| Liberians | 0.1 /100 | #290 | Tragic 17.0% |
| Immigrants | Congo | 0.1 /100 | #291 | Tragic 17.0% |
| Immigrants | Spain | 0.1 /100 | #292 | Tragic 17.0% |
| Bahamians | 0.1 /100 | #293 | Tragic 16.9% |