Immigrants from Bolivia vs South American Indian 11th Grade
COMPARE
Immigrants from Bolivia
South American Indian
11th Grade
11th Grade Comparison
Immigrants from Bolivia
South American Indians
91.7%
11TH GRADE
2.8/ 100
METRIC RATING
237th/ 347
METRIC RANK
92.0%
11TH GRADE
7.6/ 100
METRIC RATING
220th/ 347
METRIC RANK
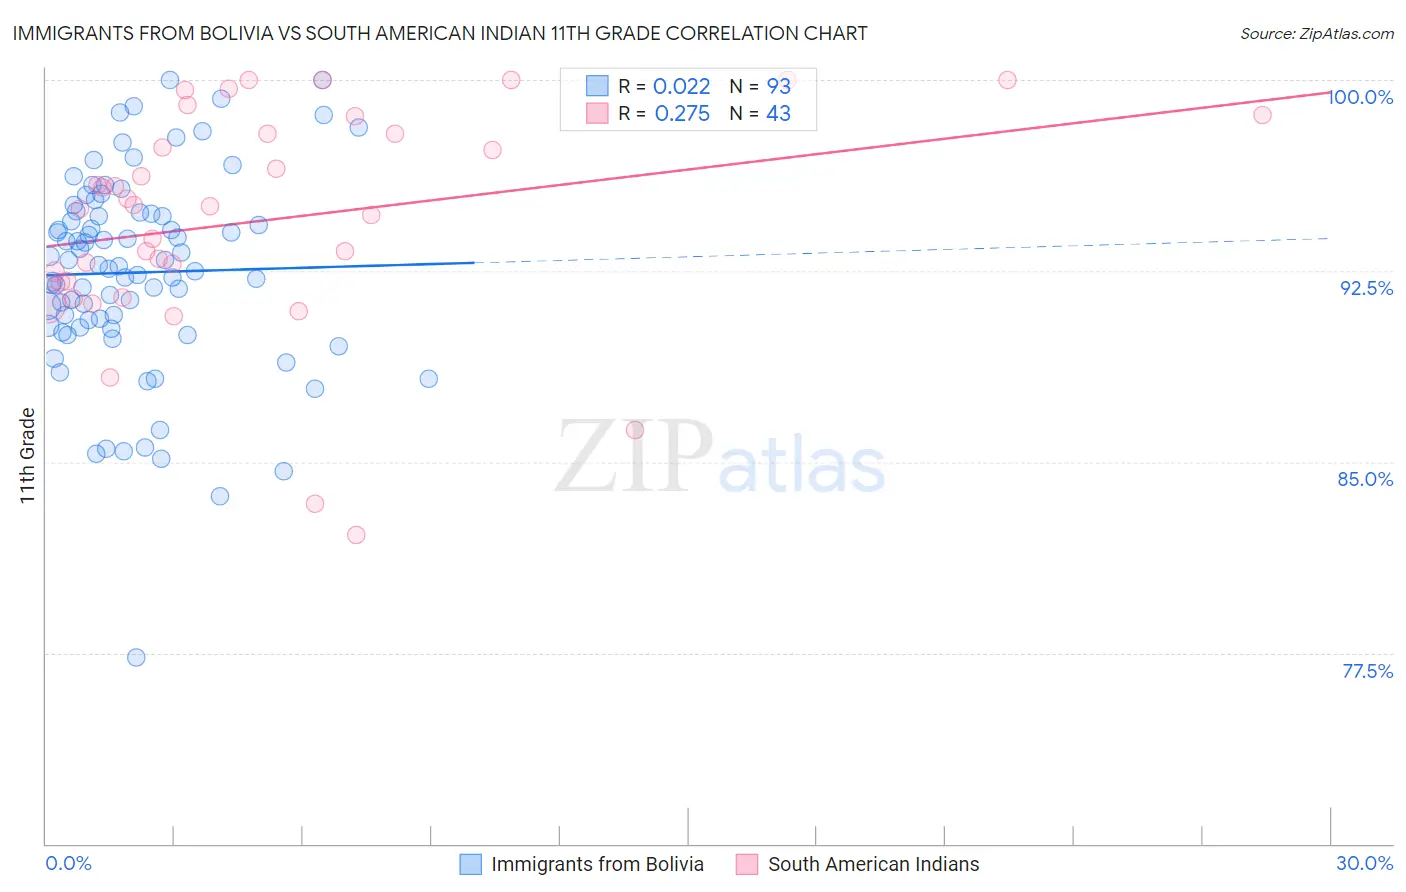
Immigrants from Bolivia vs South American Indian 11th Grade Correlation Chart
The statistical analysis conducted on geographies consisting of 158,727,043 people shows no correlation between the proportion of Immigrants from Bolivia and percentage of population with at least 11th grade education in the United States with a correlation coefficient (R) of 0.022 and weighted average of 91.7%. Similarly, the statistical analysis conducted on geographies consisting of 164,573,401 people shows a weak positive correlation between the proportion of South American Indians and percentage of population with at least 11th grade education in the United States with a correlation coefficient (R) of 0.275 and weighted average of 92.0%, a difference of 0.26%.
11th Grade Correlation Summary
| Measurement | Immigrants from Bolivia | South American Indian |
| Minimum | 77.3% | 82.1% |
| Maximum | 100.0% | 100.0% |
| Range | 22.7% | 17.9% |
| Mean | 92.4% | 94.5% |
| Median | 92.7% | 95.0% |
| Interquartile 25% (IQ1) | 90.3% | 92.0% |
| Interquartile 75% (IQ3) | 94.8% | 97.9% |
| Interquartile Range (IQR) | 4.5% | 5.8% |
| Standard Deviation (Sample) | 4.0% | 4.3% |
| Standard Deviation (Population) | 3.9% | 4.3% |
Demographics Similar to Immigrants from Bolivia and South American Indians by 11th Grade
In terms of 11th grade, the demographic groups most similar to Immigrants from Bolivia are Subsaharan African (91.7%, a difference of 0.0%), Colombian (91.7%, a difference of 0.0%), Armenian (91.7%, a difference of 0.010%), Comanche (91.7%, a difference of 0.020%), and Cheyenne (91.8%, a difference of 0.040%). Similarly, the demographic groups most similar to South American Indians are Immigrants from Liberia (91.9%, a difference of 0.020%), Immigrants from Africa (91.9%, a difference of 0.040%), Immigrants from Bahamas (91.9%, a difference of 0.040%), Costa Rican (91.9%, a difference of 0.050%), and Portuguese (92.0%, a difference of 0.070%).
| Demographics | Rating | Rank | 11th Grade |
| Blackfeet | 10.1 /100 | #218 | Poor 92.0% |
| Portuguese | 10.0 /100 | #219 | Tragic 92.0% |
| South American Indians | 7.6 /100 | #220 | Tragic 92.0% |
| Immigrants | Liberia | 7.0 /100 | #221 | Tragic 91.9% |
| Immigrants | Africa | 6.5 /100 | #222 | Tragic 91.9% |
| Immigrants | Bahamas | 6.5 /100 | #223 | Tragic 91.9% |
| Costa Ricans | 6.3 /100 | #224 | Tragic 91.9% |
| Immigrants | Zaire | 5.4 /100 | #225 | Tragic 91.9% |
| Immigrants | Somalia | 5.2 /100 | #226 | Tragic 91.9% |
| Immigrants | Cameroon | 4.4 /100 | #227 | Tragic 91.8% |
| Immigrants | Panama | 4.3 /100 | #228 | Tragic 91.8% |
| Nigerians | 4.3 /100 | #229 | Tragic 91.8% |
| Immigrants | Afghanistan | 3.9 /100 | #230 | Tragic 91.8% |
| Choctaw | 3.7 /100 | #231 | Tragic 91.8% |
| Uruguayans | 3.5 /100 | #232 | Tragic 91.8% |
| Cheyenne | 3.3 /100 | #233 | Tragic 91.8% |
| Armenians | 2.9 /100 | #234 | Tragic 91.7% |
| Sub-Saharan Africans | 2.9 /100 | #235 | Tragic 91.7% |
| Colombians | 2.8 /100 | #236 | Tragic 91.7% |
| Immigrants | Bolivia | 2.8 /100 | #237 | Tragic 91.7% |
| Comanche | 2.6 /100 | #238 | Tragic 91.7% |