Immigrants from Bolivia vs Immigrants from Iraq 1 or more Vehicles in Household
COMPARE
Immigrants from Bolivia
Immigrants from Iraq
1 or more Vehicles in Household
1 or more Vehicles in Household Comparison
Immigrants from Bolivia
Immigrants from Iraq
91.2%
1 OR MORE VEHICLES IN HOUSEHOLD
98.6/ 100
METRIC RATING
99th/ 347
METRIC RANK
92.5%
1 OR MORE VEHICLES IN HOUSEHOLD
100.0/ 100
METRIC RATING
25th/ 347
METRIC RANK
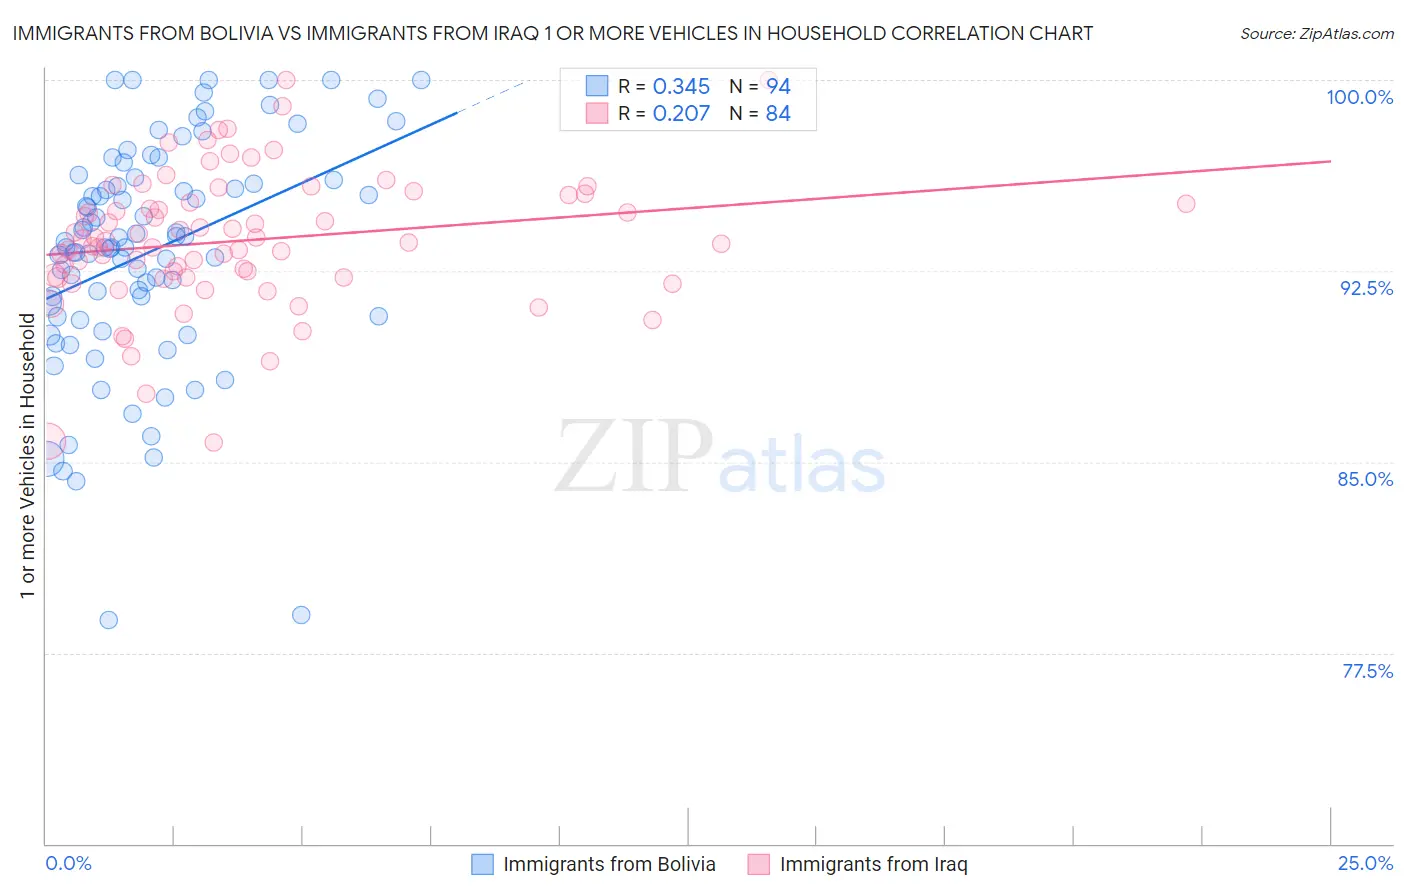
Immigrants from Bolivia vs Immigrants from Iraq 1 or more Vehicles in Household Correlation Chart
The statistical analysis conducted on geographies consisting of 158,721,920 people shows a mild positive correlation between the proportion of Immigrants from Bolivia and percentage of households with 1 or more vehicles available in the United States with a correlation coefficient (R) of 0.345 and weighted average of 91.2%. Similarly, the statistical analysis conducted on geographies consisting of 194,729,902 people shows a weak positive correlation between the proportion of Immigrants from Iraq and percentage of households with 1 or more vehicles available in the United States with a correlation coefficient (R) of 0.207 and weighted average of 92.5%, a difference of 1.5%.
1 or more Vehicles in Household Correlation Summary
| Measurement | Immigrants from Bolivia | Immigrants from Iraq |
| Minimum | 78.8% | 85.8% |
| Maximum | 100.0% | 100.0% |
| Range | 21.2% | 14.2% |
| Mean | 93.3% | 93.7% |
| Median | 93.5% | 93.6% |
| Interquartile 25% (IQ1) | 90.7% | 92.3% |
| Interquartile 75% (IQ3) | 96.1% | 95.3% |
| Interquartile Range (IQR) | 5.4% | 3.1% |
| Standard Deviation (Sample) | 4.4% | 2.7% |
| Standard Deviation (Population) | 4.4% | 2.7% |
Similar Demographics by 1 or more Vehicles in Household
Demographics Similar to Immigrants from Bolivia by 1 or more Vehicles in Household
In terms of 1 or more vehicles in household, the demographic groups most similar to Immigrants from Bolivia are Slavic (91.2%, a difference of 0.020%), Immigrants from Central America (91.1%, a difference of 0.040%), Bulgarian (91.1%, a difference of 0.050%), Seminole (91.1%, a difference of 0.070%), and Yugoslavian (91.1%, a difference of 0.080%).
| Demographics | Rating | Rank | 1 or more Vehicles in Household |
| Bhutanese | 99.2 /100 | #92 | Exceptional 91.4% |
| Immigrants | North America | 99.2 /100 | #93 | Exceptional 91.4% |
| Immigrants | Cuba | 99.1 /100 | #94 | Exceptional 91.3% |
| Austrians | 99.0 /100 | #95 | Exceptional 91.3% |
| Potawatomi | 99.0 /100 | #96 | Exceptional 91.3% |
| Pakistanis | 99.0 /100 | #97 | Exceptional 91.3% |
| Slavs | 98.7 /100 | #98 | Exceptional 91.2% |
| Immigrants | Bolivia | 98.6 /100 | #99 | Exceptional 91.2% |
| Immigrants | Central America | 98.4 /100 | #100 | Exceptional 91.1% |
| Bulgarians | 98.4 /100 | #101 | Exceptional 91.1% |
| Seminole | 98.3 /100 | #102 | Exceptional 91.1% |
| Yugoslavians | 98.3 /100 | #103 | Exceptional 91.1% |
| Asians | 98.2 /100 | #104 | Exceptional 91.1% |
| Laotians | 98.0 /100 | #105 | Exceptional 91.0% |
| Zimbabweans | 97.7 /100 | #106 | Exceptional 91.0% |
Demographics Similar to Immigrants from Iraq by 1 or more Vehicles in Household
In terms of 1 or more vehicles in household, the demographic groups most similar to Immigrants from Iraq are Yaqui (92.6%, a difference of 0.020%), British (92.5%, a difference of 0.020%), American (92.5%, a difference of 0.060%), Nepalese (92.6%, a difference of 0.090%), and Sri Lankan (92.5%, a difference of 0.10%).
| Demographics | Rating | Rank | 1 or more Vehicles in Household |
| Welsh | 100.0 /100 | #18 | Exceptional 93.0% |
| Tongans | 100.0 /100 | #19 | Exceptional 92.9% |
| Arapaho | 100.0 /100 | #20 | Exceptional 92.7% |
| Ottawa | 100.0 /100 | #21 | Exceptional 92.7% |
| French | 100.0 /100 | #22 | Exceptional 92.7% |
| Nepalese | 100.0 /100 | #23 | Exceptional 92.6% |
| Yaqui | 100.0 /100 | #24 | Exceptional 92.6% |
| Immigrants | Iraq | 100.0 /100 | #25 | Exceptional 92.5% |
| British | 100.0 /100 | #26 | Exceptional 92.5% |
| Americans | 100.0 /100 | #27 | Exceptional 92.5% |
| Sri Lankans | 100.0 /100 | #28 | Exceptional 92.5% |
| Native Hawaiians | 100.0 /100 | #29 | Exceptional 92.4% |
| Finns | 100.0 /100 | #30 | Exceptional 92.4% |
| Samoans | 100.0 /100 | #31 | Exceptional 92.4% |
| Basques | 100.0 /100 | #32 | Exceptional 92.4% |