Immigrants from Bolivia vs Croatian 1 or more Vehicles in Household
COMPARE
Immigrants from Bolivia
Croatian
1 or more Vehicles in Household
1 or more Vehicles in Household Comparison
Immigrants from Bolivia
Croatians
91.2%
1 OR MORE VEHICLES IN HOUSEHOLD
98.6/ 100
METRIC RATING
99th/ 347
METRIC RANK
91.9%
1 OR MORE VEHICLES IN HOUSEHOLD
99.8/ 100
METRIC RATING
64th/ 347
METRIC RANK
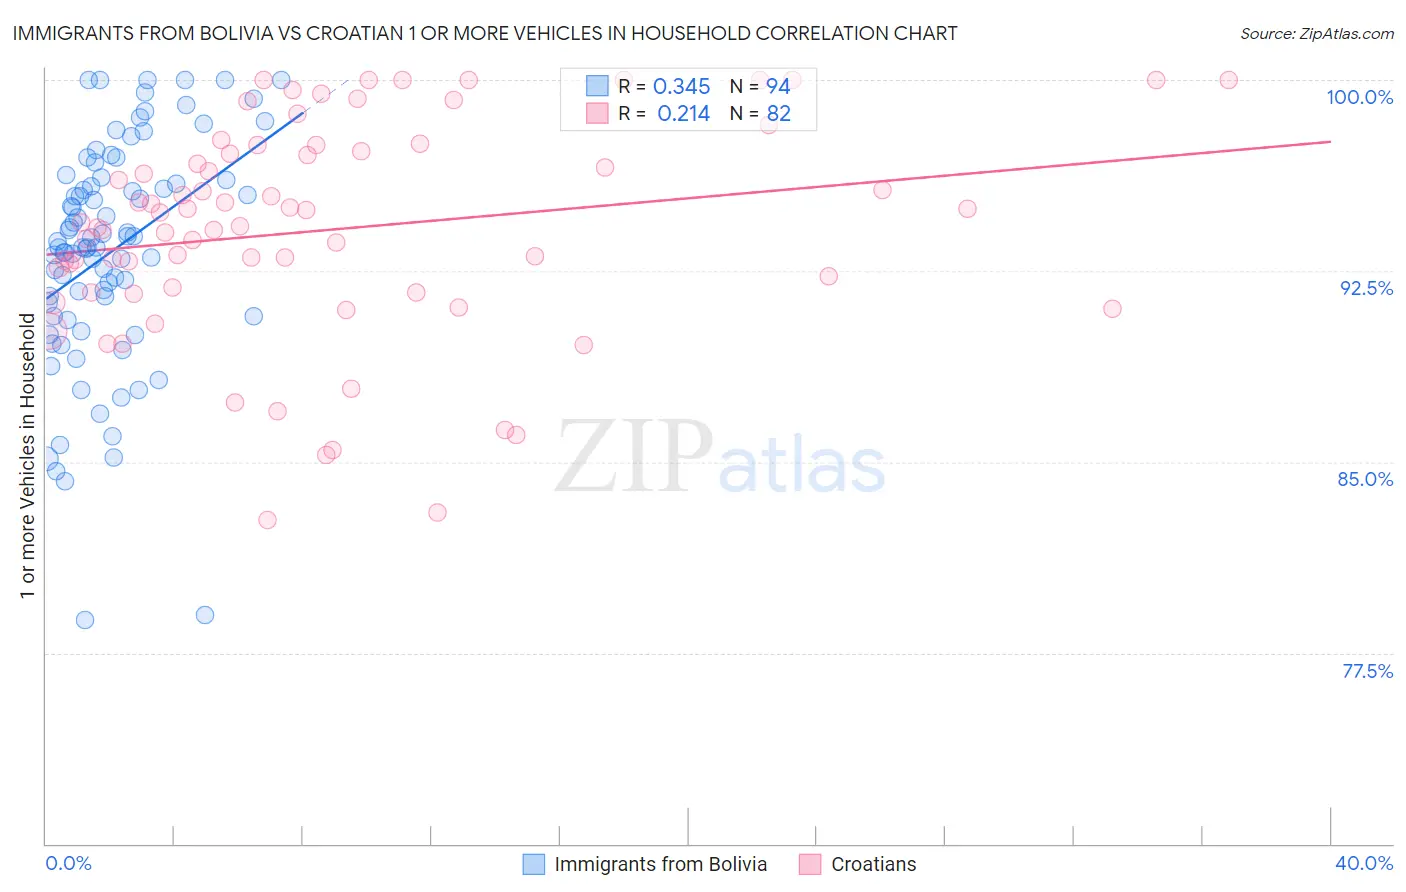
Immigrants from Bolivia vs Croatian 1 or more Vehicles in Household Correlation Chart
The statistical analysis conducted on geographies consisting of 158,721,920 people shows a mild positive correlation between the proportion of Immigrants from Bolivia and percentage of households with 1 or more vehicles available in the United States with a correlation coefficient (R) of 0.345 and weighted average of 91.2%. Similarly, the statistical analysis conducted on geographies consisting of 375,584,731 people shows a weak positive correlation between the proportion of Croatians and percentage of households with 1 or more vehicles available in the United States with a correlation coefficient (R) of 0.214 and weighted average of 91.9%, a difference of 0.74%.
1 or more Vehicles in Household Correlation Summary
| Measurement | Immigrants from Bolivia | Croatian |
| Minimum | 78.8% | 82.7% |
| Maximum | 100.0% | 100.0% |
| Range | 21.2% | 17.3% |
| Mean | 93.3% | 94.1% |
| Median | 93.5% | 94.3% |
| Interquartile 25% (IQ1) | 90.7% | 91.7% |
| Interquartile 75% (IQ3) | 96.1% | 97.2% |
| Interquartile Range (IQR) | 5.4% | 5.5% |
| Standard Deviation (Sample) | 4.4% | 4.2% |
| Standard Deviation (Population) | 4.4% | 4.2% |
Similar Demographics by 1 or more Vehicles in Household
Demographics Similar to Immigrants from Bolivia by 1 or more Vehicles in Household
In terms of 1 or more vehicles in household, the demographic groups most similar to Immigrants from Bolivia are Slavic (91.2%, a difference of 0.020%), Immigrants from Central America (91.1%, a difference of 0.040%), Bulgarian (91.1%, a difference of 0.050%), Seminole (91.1%, a difference of 0.070%), and Yugoslavian (91.1%, a difference of 0.080%).
| Demographics | Rating | Rank | 1 or more Vehicles in Household |
| Bhutanese | 99.2 /100 | #92 | Exceptional 91.4% |
| Immigrants | North America | 99.2 /100 | #93 | Exceptional 91.4% |
| Immigrants | Cuba | 99.1 /100 | #94 | Exceptional 91.3% |
| Austrians | 99.0 /100 | #95 | Exceptional 91.3% |
| Potawatomi | 99.0 /100 | #96 | Exceptional 91.3% |
| Pakistanis | 99.0 /100 | #97 | Exceptional 91.3% |
| Slavs | 98.7 /100 | #98 | Exceptional 91.2% |
| Immigrants | Bolivia | 98.6 /100 | #99 | Exceptional 91.2% |
| Immigrants | Central America | 98.4 /100 | #100 | Exceptional 91.1% |
| Bulgarians | 98.4 /100 | #101 | Exceptional 91.1% |
| Seminole | 98.3 /100 | #102 | Exceptional 91.1% |
| Yugoslavians | 98.3 /100 | #103 | Exceptional 91.1% |
| Asians | 98.2 /100 | #104 | Exceptional 91.1% |
| Laotians | 98.0 /100 | #105 | Exceptional 91.0% |
| Zimbabweans | 97.7 /100 | #106 | Exceptional 91.0% |
Demographics Similar to Croatians by 1 or more Vehicles in Household
In terms of 1 or more vehicles in household, the demographic groups most similar to Croatians are Chinese (91.9%, a difference of 0.010%), Immigrants from India (91.9%, a difference of 0.030%), Thai (91.9%, a difference of 0.030%), Immigrants from Laos (91.8%, a difference of 0.030%), and Slovak (91.9%, a difference of 0.050%).
| Demographics | Rating | Rank | 1 or more Vehicles in Household |
| Iraqis | 99.8 /100 | #57 | Exceptional 91.9% |
| Immigrants | Mexico | 99.8 /100 | #58 | Exceptional 91.9% |
| Venezuelans | 99.8 /100 | #59 | Exceptional 91.9% |
| Slovaks | 99.8 /100 | #60 | Exceptional 91.9% |
| Immigrants | India | 99.8 /100 | #61 | Exceptional 91.9% |
| Thais | 99.8 /100 | #62 | Exceptional 91.9% |
| Chinese | 99.8 /100 | #63 | Exceptional 91.9% |
| Croatians | 99.8 /100 | #64 | Exceptional 91.9% |
| Immigrants | Laos | 99.8 /100 | #65 | Exceptional 91.8% |
| Canadians | 99.8 /100 | #66 | Exceptional 91.8% |
| Spaniards | 99.8 /100 | #67 | Exceptional 91.8% |
| Immigrants | Scotland | 99.7 /100 | #68 | Exceptional 91.8% |
| Palestinians | 99.7 /100 | #69 | Exceptional 91.7% |
| Lithuanians | 99.7 /100 | #70 | Exceptional 91.7% |
| Poles | 99.7 /100 | #71 | Exceptional 91.7% |