Immigrants from Bolivia vs South American Indian Family Households
COMPARE
Immigrants from Bolivia
South American Indian
Family Households
Family Households Comparison
Immigrants from Bolivia
South American Indians
66.6%
FAMILY HOUSEHOLDS
100.0/ 100
METRIC RATING
41st/ 347
METRIC RANK
64.6%
FAMILY HOUSEHOLDS
81.9/ 100
METRIC RATING
144th/ 347
METRIC RANK
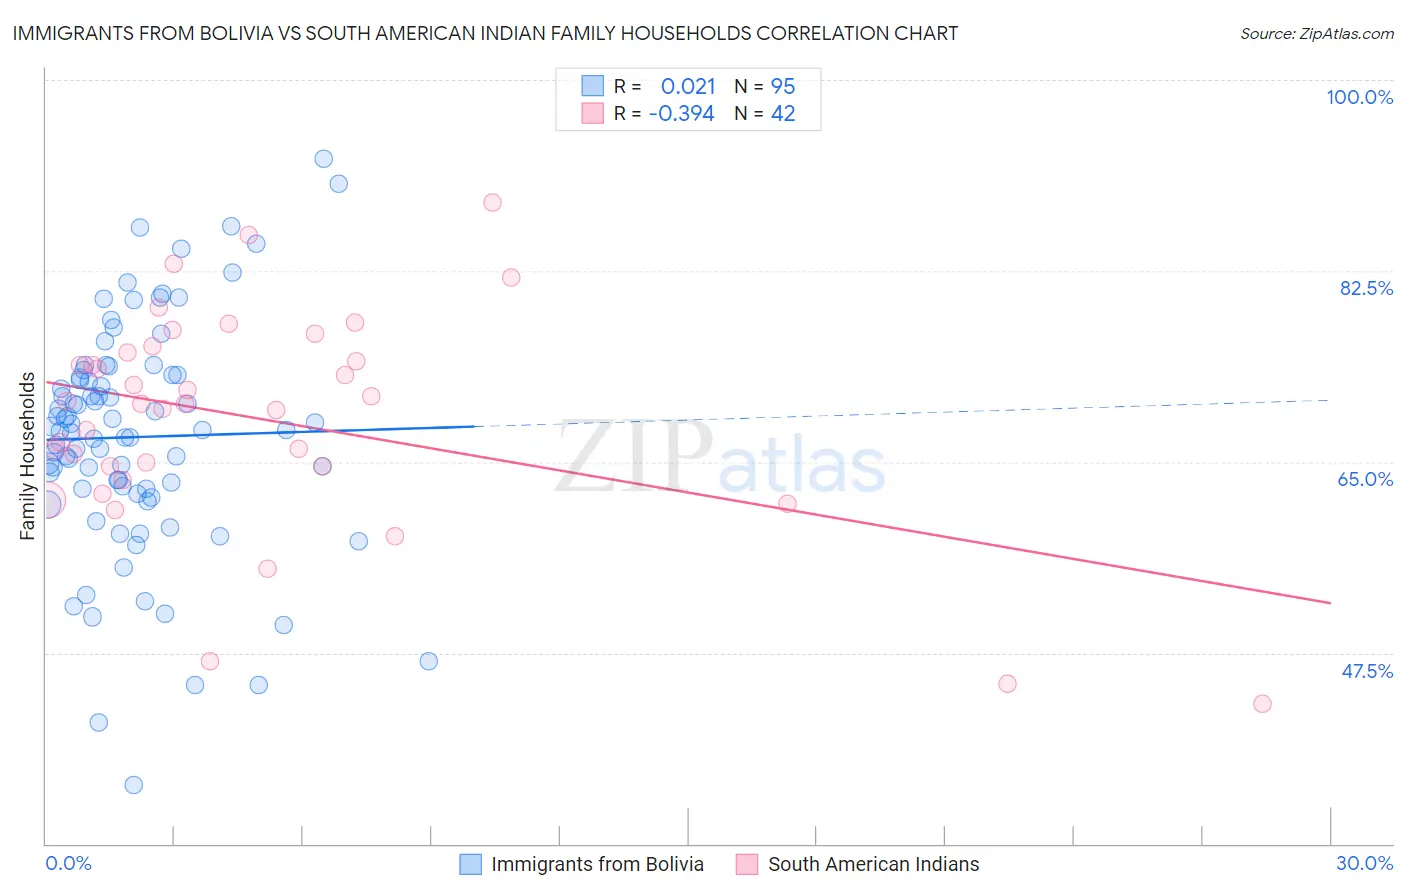
Immigrants from Bolivia vs South American Indian Family Households Correlation Chart
The statistical analysis conducted on geographies consisting of 158,720,883 people shows no correlation between the proportion of Immigrants from Bolivia and percentage of family households in the United States with a correlation coefficient (R) of 0.021 and weighted average of 66.6%. Similarly, the statistical analysis conducted on geographies consisting of 164,540,449 people shows a mild negative correlation between the proportion of South American Indians and percentage of family households in the United States with a correlation coefficient (R) of -0.394 and weighted average of 64.6%, a difference of 3.0%.
Family Households Correlation Summary
| Measurement | Immigrants from Bolivia | South American Indian |
| Minimum | 35.4% | 42.9% |
| Maximum | 92.8% | 88.8% |
| Range | 57.4% | 45.9% |
| Mean | 67.3% | 69.0% |
| Median | 67.9% | 70.3% |
| Interquartile 25% (IQ1) | 62.5% | 64.6% |
| Interquartile 75% (IQ3) | 73.0% | 75.0% |
| Interquartile Range (IQR) | 10.5% | 10.5% |
| Standard Deviation (Sample) | 10.5% | 10.0% |
| Standard Deviation (Population) | 10.4% | 9.9% |
Similar Demographics by Family Households
Demographics Similar to Immigrants from Bolivia by Family Households
In terms of family households, the demographic groups most similar to Immigrants from Bolivia are Guamanian/Chamorro (66.6%, a difference of 0.030%), Menominee (66.5%, a difference of 0.060%), Apache (66.5%, a difference of 0.070%), Asian (66.5%, a difference of 0.11%), and Venezuelan (66.5%, a difference of 0.14%).
| Demographics | Rating | Rank | Family Households |
| Thais | 100.0 /100 | #34 | Exceptional 67.2% |
| Tohono O'odham | 100.0 /100 | #35 | Exceptional 67.1% |
| Peruvians | 100.0 /100 | #36 | Exceptional 67.1% |
| Tsimshian | 100.0 /100 | #37 | Exceptional 67.1% |
| Mexican American Indians | 100.0 /100 | #38 | Exceptional 67.0% |
| Immigrants | El Salvador | 100.0 /100 | #39 | Exceptional 67.0% |
| Guamanians/Chamorros | 100.0 /100 | #40 | Exceptional 66.6% |
| Immigrants | Bolivia | 100.0 /100 | #41 | Exceptional 66.6% |
| Menominee | 100.0 /100 | #42 | Exceptional 66.5% |
| Apache | 100.0 /100 | #43 | Exceptional 66.5% |
| Asians | 100.0 /100 | #44 | Exceptional 66.5% |
| Venezuelans | 100.0 /100 | #45 | Exceptional 66.5% |
| Arapaho | 100.0 /100 | #46 | Exceptional 66.5% |
| Bolivians | 100.0 /100 | #47 | Exceptional 66.5% |
| Immigrants | Venezuela | 100.0 /100 | #48 | Exceptional 66.4% |
Demographics Similar to South American Indians by Family Households
In terms of family households, the demographic groups most similar to South American Indians are Czechoslovakian (64.6%, a difference of 0.0%), Welsh (64.6%, a difference of 0.040%), Pakistani (64.7%, a difference of 0.050%), Immigrants from North Macedonia (64.7%, a difference of 0.070%), and Immigrants from Cameroon (64.7%, a difference of 0.070%).
| Demographics | Rating | Rank | Family Households |
| Immigrants | Scotland | 86.4 /100 | #137 | Excellent 64.7% |
| Basques | 85.5 /100 | #138 | Excellent 64.7% |
| Immigrants | Jamaica | 85.3 /100 | #139 | Excellent 64.7% |
| Immigrants | North Macedonia | 84.9 /100 | #140 | Excellent 64.7% |
| Immigrants | Cameroon | 84.8 /100 | #141 | Excellent 64.7% |
| Pakistanis | 84.0 /100 | #142 | Excellent 64.7% |
| Czechoslovakians | 82.1 /100 | #143 | Excellent 64.6% |
| South American Indians | 81.9 /100 | #144 | Excellent 64.6% |
| Welsh | 80.1 /100 | #145 | Excellent 64.6% |
| Immigrants | Romania | 77.0 /100 | #146 | Good 64.6% |
| Immigrants | Chile | 76.5 /100 | #147 | Good 64.6% |
| Delaware | 76.3 /100 | #148 | Good 64.6% |
| Sioux | 76.3 /100 | #149 | Good 64.6% |
| Romanians | 75.3 /100 | #150 | Good 64.5% |
| Syrians | 75.2 /100 | #151 | Good 64.5% |