Immigrants from Bolivia vs Houma Vision Disability
COMPARE
Immigrants from Bolivia
Houma
Vision Disability
Vision Disability Comparison
Immigrants from Bolivia
Houma
1.8%
VISION DISABILITY
100.0/ 100
METRIC RATING
15th/ 347
METRIC RANK
3.4%
VISION DISABILITY
0.0/ 100
METRIC RATING
346th/ 347
METRIC RANK
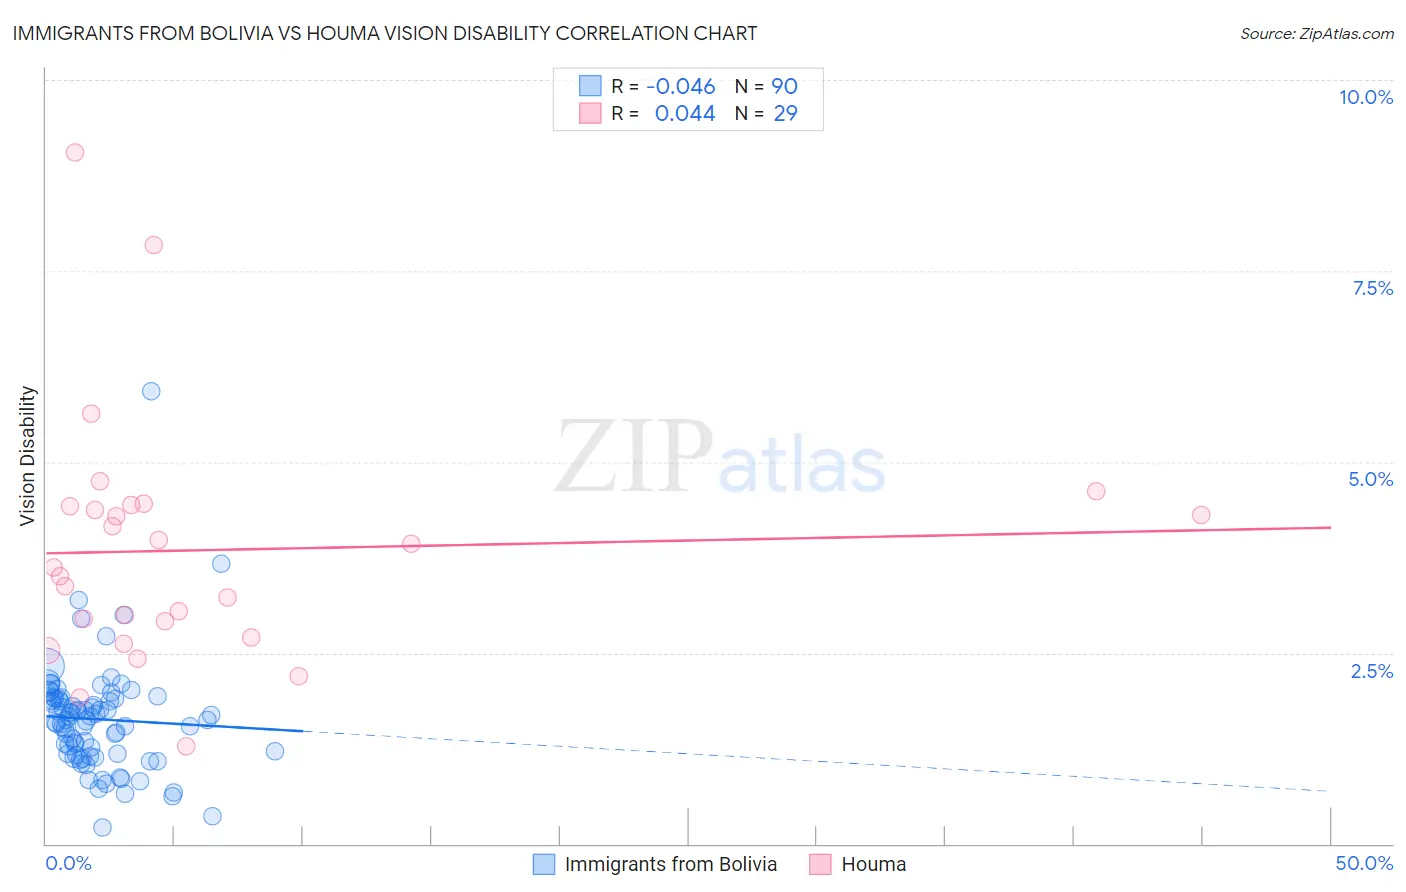
Immigrants from Bolivia vs Houma Vision Disability Correlation Chart
The statistical analysis conducted on geographies consisting of 158,695,494 people shows no correlation between the proportion of Immigrants from Bolivia and percentage of population with vision disability in the United States with a correlation coefficient (R) of -0.046 and weighted average of 1.8%. Similarly, the statistical analysis conducted on geographies consisting of 36,790,703 people shows no correlation between the proportion of Houma and percentage of population with vision disability in the United States with a correlation coefficient (R) of 0.044 and weighted average of 3.4%, a difference of 86.9%.
Vision Disability Correlation Summary
| Measurement | Immigrants from Bolivia | Houma |
| Minimum | 0.21% | 1.3% |
| Maximum | 5.9% | 9.0% |
| Range | 5.7% | 7.8% |
| Mean | 1.6% | 3.8% |
| Median | 1.6% | 3.6% |
| Interquartile 25% (IQ1) | 1.2% | 2.8% |
| Interquartile 75% (IQ3) | 1.9% | 4.4% |
| Interquartile Range (IQR) | 0.72% | 1.6% |
| Standard Deviation (Sample) | 0.74% | 1.6% |
| Standard Deviation (Population) | 0.74% | 1.6% |
Similar Demographics by Vision Disability
Demographics Similar to Immigrants from Bolivia by Vision Disability
In terms of vision disability, the demographic groups most similar to Immigrants from Bolivia are Immigrants from China (1.8%, a difference of 0.42%), Indian (Asian) (1.8%, a difference of 0.44%), Burmese (1.8%, a difference of 0.45%), Immigrants from Eastern Asia (1.8%, a difference of 0.57%), and Immigrants from Korea (1.8%, a difference of 0.65%).
| Demographics | Rating | Rank | Vision Disability |
| Iranians | 100.0 /100 | #8 | Exceptional 1.8% |
| Immigrants | Singapore | 100.0 /100 | #9 | Exceptional 1.8% |
| Immigrants | Hong Kong | 100.0 /100 | #10 | Exceptional 1.8% |
| Immigrants | Israel | 100.0 /100 | #11 | Exceptional 1.8% |
| Immigrants | Korea | 100.0 /100 | #12 | Exceptional 1.8% |
| Immigrants | Eastern Asia | 100.0 /100 | #13 | Exceptional 1.8% |
| Immigrants | China | 100.0 /100 | #14 | Exceptional 1.8% |
| Immigrants | Bolivia | 100.0 /100 | #15 | Exceptional 1.8% |
| Indians (Asian) | 100.0 /100 | #16 | Exceptional 1.8% |
| Burmese | 100.0 /100 | #17 | Exceptional 1.8% |
| Bolivians | 100.0 /100 | #18 | Exceptional 1.9% |
| Immigrants | Sri Lanka | 100.0 /100 | #19 | Exceptional 1.9% |
| Asians | 100.0 /100 | #20 | Exceptional 1.9% |
| Turks | 100.0 /100 | #21 | Exceptional 1.9% |
| Immigrants | Pakistan | 100.0 /100 | #22 | Exceptional 1.9% |
Demographics Similar to Houma by Vision Disability
In terms of vision disability, the demographic groups most similar to Houma are Lumbee (3.4%, a difference of 1.7%), Pueblo (3.3%, a difference of 3.3%), Pima (3.3%, a difference of 3.3%), Choctaw (3.3%, a difference of 4.4%), and Kiowa (3.3%, a difference of 5.9%).
| Demographics | Rating | Rank | Vision Disability |
| Cajuns | 0.0 /100 | #333 | Tragic 3.1% |
| Cheyenne | 0.0 /100 | #334 | Tragic 3.1% |
| Navajo | 0.0 /100 | #335 | Tragic 3.1% |
| Alaskan Athabascans | 0.0 /100 | #336 | Tragic 3.1% |
| Dutch West Indians | 0.0 /100 | #337 | Tragic 3.2% |
| Chickasaw | 0.0 /100 | #338 | Tragic 3.2% |
| Tsimshian | 0.0 /100 | #339 | Tragic 3.2% |
| Creek | 0.0 /100 | #340 | Tragic 3.2% |
| Kiowa | 0.0 /100 | #341 | Tragic 3.3% |
| Choctaw | 0.0 /100 | #342 | Tragic 3.3% |
| Pima | 0.0 /100 | #343 | Tragic 3.3% |
| Pueblo | 0.0 /100 | #344 | Tragic 3.3% |
| Lumbee | 0.0 /100 | #345 | Tragic 3.4% |
| Houma | 0.0 /100 | #346 | Tragic 3.4% |
| Puerto Ricans | 0.0 /100 | #347 | Tragic 3.9% |