Fijian vs Houma 3 or more Vehicles in Household
COMPARE
Fijian
Houma
3 or more Vehicles in Household
3 or more Vehicles in Household Comparison
Fijians
Houma
22.2%
3 OR MORE VEHICLES IN HOUSEHOLD
99.9/ 100
METRIC RATING
62nd/ 347
METRIC RANK
16.1%
3 OR MORE VEHICLES IN HOUSEHOLD
0.0/ 100
METRIC RATING
308th/ 347
METRIC RANK
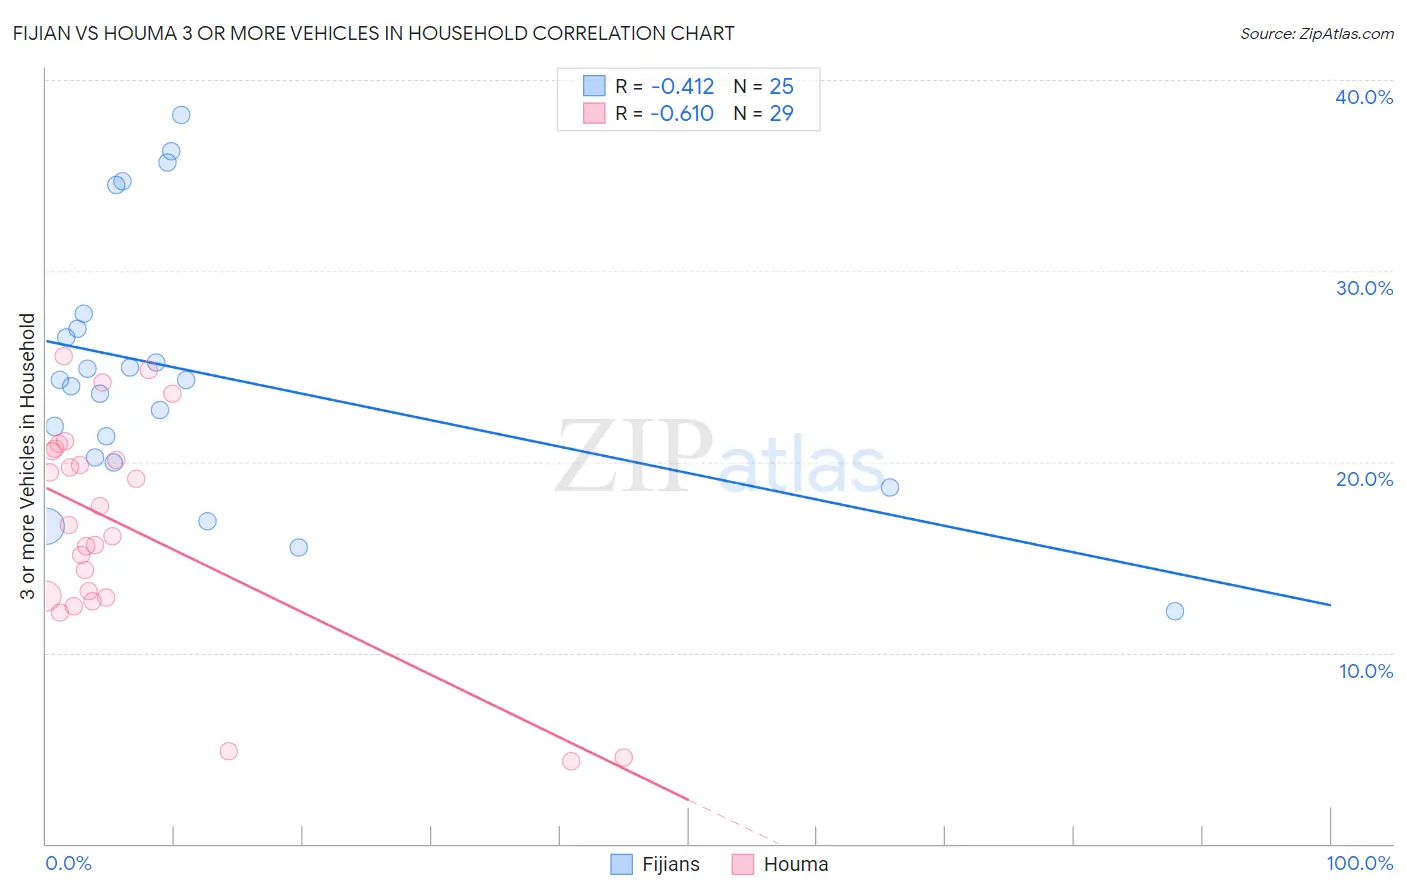
Fijian vs Houma 3 or more Vehicles in Household Correlation Chart
The statistical analysis conducted on geographies consisting of 55,946,272 people shows a moderate negative correlation between the proportion of Fijians and percentage of households with 3 or more vehicles available in the United States with a correlation coefficient (R) of -0.412 and weighted average of 22.2%. Similarly, the statistical analysis conducted on geographies consisting of 36,793,119 people shows a significant negative correlation between the proportion of Houma and percentage of households with 3 or more vehicles available in the United States with a correlation coefficient (R) of -0.610 and weighted average of 16.1%, a difference of 38.4%.
3 or more Vehicles in Household Correlation Summary
| Measurement | Fijian | Houma |
| Minimum | 12.2% | 4.3% |
| Maximum | 38.1% | 25.5% |
| Range | 26.0% | 21.2% |
| Mean | 24.7% | 16.6% |
| Median | 24.3% | 16.7% |
| Interquartile 25% (IQ1) | 20.1% | 12.9% |
| Interquartile 75% (IQ3) | 27.4% | 20.6% |
| Interquartile Range (IQR) | 7.3% | 7.7% |
| Standard Deviation (Sample) | 6.8% | 5.7% |
| Standard Deviation (Population) | 6.7% | 5.6% |
Similar Demographics by 3 or more Vehicles in Household
Demographics Similar to Fijians by 3 or more Vehicles in Household
In terms of 3 or more vehicles in household, the demographic groups most similar to Fijians are Bhutanese (22.2%, a difference of 0.040%), Chickasaw (22.2%, a difference of 0.16%), Finnish (22.3%, a difference of 0.20%), Navajo (22.3%, a difference of 0.28%), and Spaniard (22.3%, a difference of 0.35%).
| Demographics | Rating | Rank | 3 or more Vehicles in Household |
| Immigrants | Laos | 100.0 /100 | #55 | Exceptional 22.4% |
| Hispanics or Latinos | 100.0 /100 | #56 | Exceptional 22.4% |
| Pennsylvania Germans | 100.0 /100 | #57 | Exceptional 22.3% |
| Spaniards | 100.0 /100 | #58 | Exceptional 22.3% |
| Navajo | 100.0 /100 | #59 | Exceptional 22.3% |
| Finns | 99.9 /100 | #60 | Exceptional 22.3% |
| Bhutanese | 99.9 /100 | #61 | Exceptional 22.2% |
| Fijians | 99.9 /100 | #62 | Exceptional 22.2% |
| Chickasaw | 99.9 /100 | #63 | Exceptional 22.2% |
| Immigrants | Taiwan | 99.9 /100 | #64 | Exceptional 22.1% |
| Pima | 99.9 /100 | #65 | Exceptional 22.0% |
| Northern Europeans | 99.9 /100 | #66 | Exceptional 22.0% |
| Alaskan Athabascans | 99.9 /100 | #67 | Exceptional 21.9% |
| British | 99.9 /100 | #68 | Exceptional 21.9% |
| Creek | 99.9 /100 | #69 | Exceptional 21.9% |
Demographics Similar to Houma by 3 or more Vehicles in Household
In terms of 3 or more vehicles in household, the demographic groups most similar to Houma are Immigrants from Ghana (16.2%, a difference of 0.59%), Somali (16.2%, a difference of 0.74%), Immigrants from Somalia (15.9%, a difference of 0.92%), Moroccan (15.9%, a difference of 1.2%), and Immigrants from Morocco (16.3%, a difference of 1.6%).
| Demographics | Rating | Rank | 3 or more Vehicles in Household |
| Paraguayans | 0.0 /100 | #301 | Tragic 16.6% |
| Immigrants | Greece | 0.0 /100 | #302 | Tragic 16.5% |
| Immigrants | Serbia | 0.0 /100 | #303 | Tragic 16.4% |
| Ghanaians | 0.0 /100 | #304 | Tragic 16.4% |
| Immigrants | Morocco | 0.0 /100 | #305 | Tragic 16.3% |
| Somalis | 0.0 /100 | #306 | Tragic 16.2% |
| Immigrants | Ghana | 0.0 /100 | #307 | Tragic 16.2% |
| Houma | 0.0 /100 | #308 | Tragic 16.1% |
| Immigrants | Somalia | 0.0 /100 | #309 | Tragic 15.9% |
| Moroccans | 0.0 /100 | #310 | Tragic 15.9% |
| Albanians | 0.0 /100 | #311 | Tragic 15.8% |
| Puerto Ricans | 0.0 /100 | #312 | Tragic 15.6% |
| Immigrants | Israel | 0.0 /100 | #313 | Tragic 15.6% |
| Immigrants | Belarus | 0.0 /100 | #314 | Tragic 15.5% |
| Haitians | 0.0 /100 | #315 | Tragic 15.5% |