Immigrants from Belarus vs Armenian In Labor Force | Age > 16
COMPARE
Immigrants from Belarus
Armenian
In Labor Force | Age > 16
In Labor Force | Age > 16 Comparison
Immigrants from Belarus
Armenians
65.2%
IN LABOR FORCE | AGE > 16
66.0/ 100
METRIC RATING
167th/ 347
METRIC RANK
64.9%
IN LABOR FORCE | AGE > 16
20.2/ 100
METRIC RATING
200th/ 347
METRIC RANK
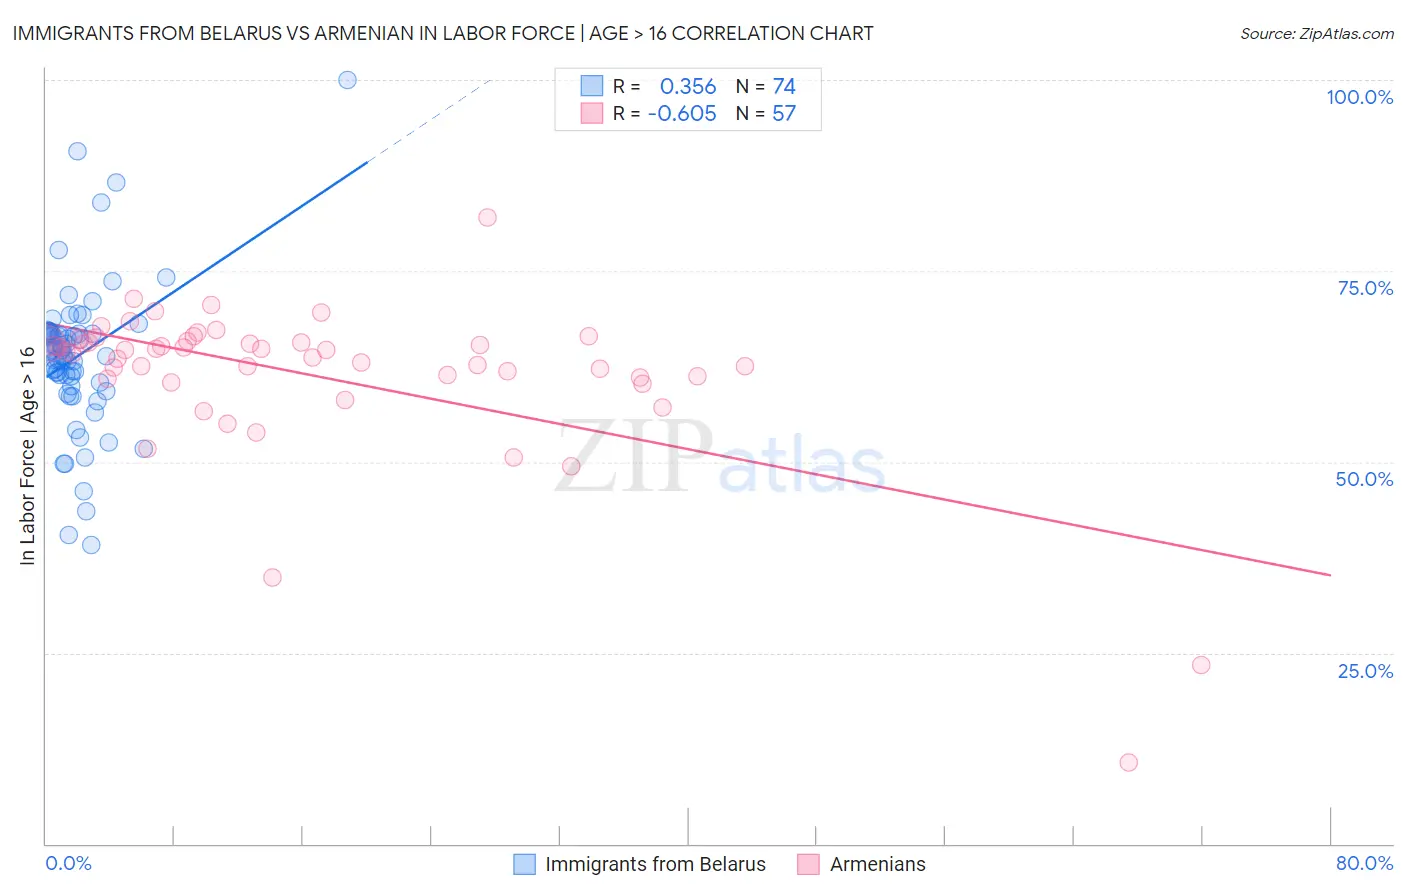
Immigrants from Belarus vs Armenian In Labor Force | Age > 16 Correlation Chart
The statistical analysis conducted on geographies consisting of 150,205,158 people shows a mild positive correlation between the proportion of Immigrants from Belarus and labor force participation rate among population ages 16 and over in the United States with a correlation coefficient (R) of 0.356 and weighted average of 65.2%. Similarly, the statistical analysis conducted on geographies consisting of 310,962,108 people shows a significant negative correlation between the proportion of Armenians and labor force participation rate among population ages 16 and over in the United States with a correlation coefficient (R) of -0.605 and weighted average of 64.9%, a difference of 0.57%.
In Labor Force | Age > 16 Correlation Summary
| Measurement | Immigrants from Belarus | Armenian |
| Minimum | 39.1% | 10.6% |
| Maximum | 100.0% | 82.0% |
| Range | 60.9% | 71.4% |
| Mean | 63.8% | 61.4% |
| Median | 64.5% | 64.4% |
| Interquartile 25% (IQ1) | 60.4% | 60.9% |
| Interquartile 75% (IQ3) | 66.8% | 65.7% |
| Interquartile Range (IQR) | 6.4% | 4.8% |
| Standard Deviation (Sample) | 9.7% | 10.8% |
| Standard Deviation (Population) | 9.7% | 10.7% |
Similar Demographics by In Labor Force | Age > 16
Demographics Similar to Immigrants from Belarus by In Labor Force | Age > 16
In terms of in labor force | age > 16, the demographic groups most similar to Immigrants from Belarus are Immigrants from Western Asia (65.3%, a difference of 0.020%), Immigrants from Kazakhstan (65.3%, a difference of 0.030%), Serbian (65.2%, a difference of 0.030%), Danish (65.3%, a difference of 0.040%), and Arab (65.2%, a difference of 0.040%).
| Demographics | Rating | Rank | In Labor Force | Age > 16 |
| Immigrants | South Africa | 73.5 /100 | #160 | Good 65.3% |
| Australians | 71.3 /100 | #161 | Good 65.3% |
| Albanians | 70.8 /100 | #162 | Good 65.3% |
| South Africans | 69.8 /100 | #163 | Good 65.3% |
| Danes | 68.8 /100 | #164 | Good 65.3% |
| Immigrants | Kazakhstan | 68.1 /100 | #165 | Good 65.3% |
| Immigrants | Western Asia | 67.3 /100 | #166 | Good 65.3% |
| Immigrants | Belarus | 66.0 /100 | #167 | Good 65.2% |
| Serbians | 63.5 /100 | #168 | Good 65.2% |
| Arabs | 62.4 /100 | #169 | Good 65.2% |
| Immigrants | Israel | 61.7 /100 | #170 | Good 65.2% |
| Israelis | 61.6 /100 | #171 | Good 65.2% |
| Immigrants | Sweden | 61.3 /100 | #172 | Good 65.2% |
| Immigrants | Ukraine | 53.7 /100 | #173 | Average 65.1% |
| Macedonians | 50.0 /100 | #174 | Average 65.1% |
Demographics Similar to Armenians by In Labor Force | Age > 16
In terms of in labor force | age > 16, the demographic groups most similar to Armenians are Ukrainian (64.9%, a difference of 0.010%), Immigrants from Belgium (64.9%, a difference of 0.020%), Russian (64.9%, a difference of 0.030%), Slovene (64.9%, a difference of 0.030%), and Jamaican (64.9%, a difference of 0.030%).
| Demographics | Rating | Rank | In Labor Force | Age > 16 |
| Immigrants | Europe | 33.6 /100 | #193 | Fair 65.0% |
| Immigrants | Southern Europe | 31.3 /100 | #194 | Fair 65.0% |
| Romanians | 31.1 /100 | #195 | Fair 65.0% |
| Haitians | 30.6 /100 | #196 | Fair 65.0% |
| Immigrants | Italy | 28.7 /100 | #197 | Fair 65.0% |
| Greeks | 26.1 /100 | #198 | Fair 64.9% |
| Mexican American Indians | 23.1 /100 | #199 | Fair 64.9% |
| Armenians | 20.2 /100 | #200 | Fair 64.9% |
| Ukrainians | 19.6 /100 | #201 | Poor 64.9% |
| Immigrants | Belgium | 19.4 /100 | #202 | Poor 64.9% |
| Russians | 18.8 /100 | #203 | Poor 64.9% |
| Slovenes | 18.7 /100 | #204 | Poor 64.9% |
| Jamaicans | 18.7 /100 | #205 | Poor 64.9% |
| Lithuanians | 17.4 /100 | #206 | Poor 64.8% |
| Immigrants | Latin America | 16.4 /100 | #207 | Poor 64.8% |