Immigrants from Philippines vs Jamaican 1 or more Vehicles in Household
COMPARE
Immigrants from Philippines
Jamaican
1 or more Vehicles in Household
1 or more Vehicles in Household Comparison
Immigrants from Philippines
Jamaicans
91.5%
1 OR MORE VEHICLES IN HOUSEHOLD
99.4/ 100
METRIC RATING
77th/ 347
METRIC RANK
82.1%
1 OR MORE VEHICLES IN HOUSEHOLD
0.0/ 100
METRIC RATING
321st/ 347
METRIC RANK
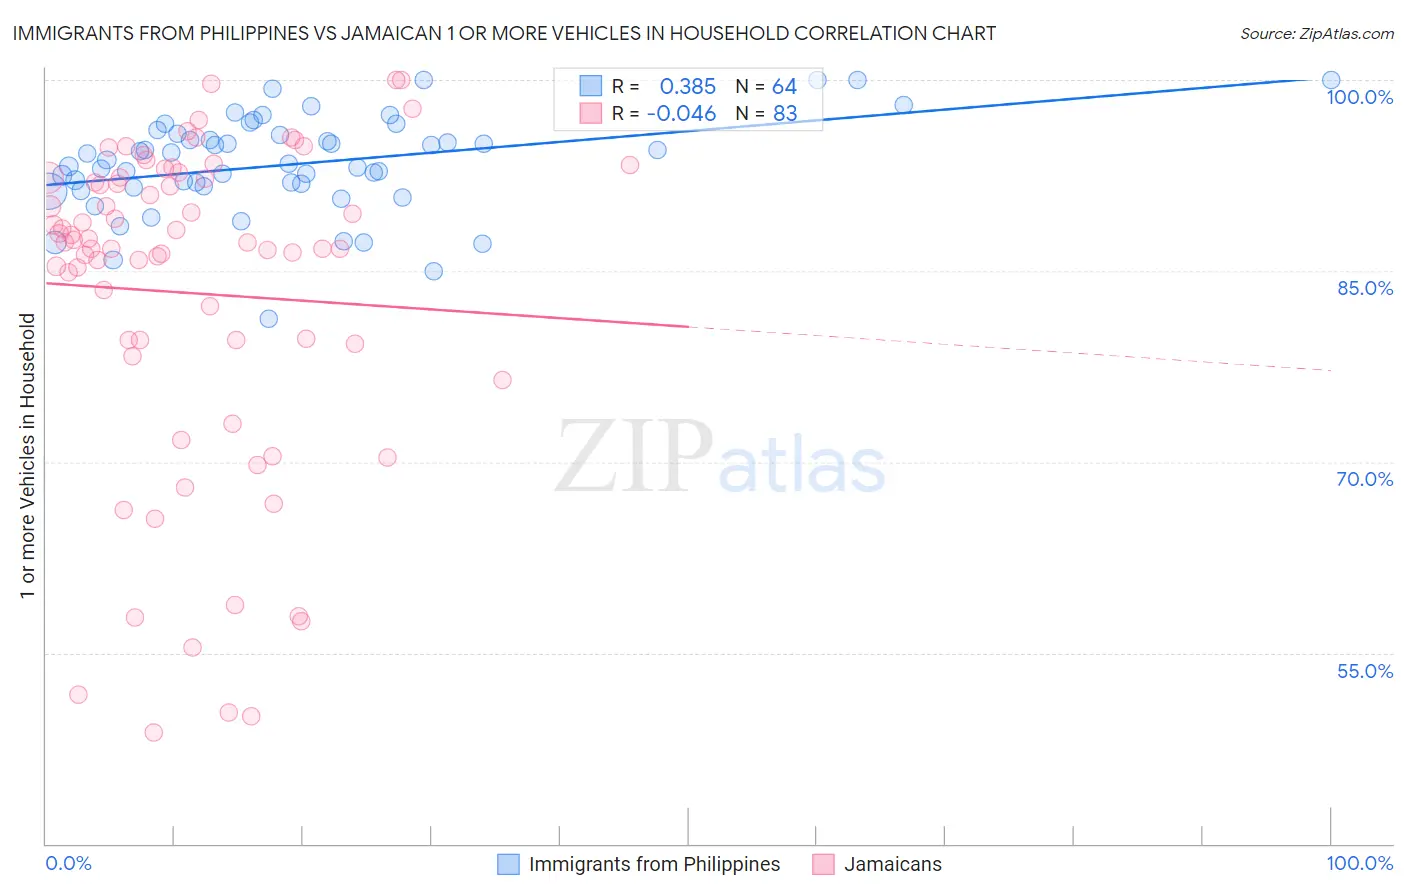
Immigrants from Philippines vs Jamaican 1 or more Vehicles in Household Correlation Chart
The statistical analysis conducted on geographies consisting of 471,073,729 people shows a mild positive correlation between the proportion of Immigrants from Philippines and percentage of households with 1 or more vehicles available in the United States with a correlation coefficient (R) of 0.385 and weighted average of 91.5%. Similarly, the statistical analysis conducted on geographies consisting of 367,719,271 people shows no correlation between the proportion of Jamaicans and percentage of households with 1 or more vehicles available in the United States with a correlation coefficient (R) of -0.046 and weighted average of 82.1%, a difference of 11.4%.
1 or more Vehicles in Household Correlation Summary
| Measurement | Immigrants from Philippines | Jamaican |
| Minimum | 81.2% | 48.7% |
| Maximum | 100.0% | 100.0% |
| Range | 18.8% | 51.3% |
| Mean | 93.4% | 83.3% |
| Median | 93.6% | 87.2% |
| Interquartile 25% (IQ1) | 91.6% | 79.3% |
| Interquartile 75% (IQ3) | 95.7% | 92.3% |
| Interquartile Range (IQR) | 4.1% | 13.0% |
| Standard Deviation (Sample) | 3.8% | 13.0% |
| Standard Deviation (Population) | 3.8% | 12.9% |
Similar Demographics by 1 or more Vehicles in Household
Demographics Similar to Immigrants from Philippines by 1 or more Vehicles in Household
In terms of 1 or more vehicles in household, the demographic groups most similar to Immigrants from Philippines are Iranian (91.5%, a difference of 0.0%), Immigrants from South Central Asia (91.5%, a difference of 0.020%), Bolivian (91.5%, a difference of 0.030%), Cuban (91.5%, a difference of 0.040%), and Portuguese (91.6%, a difference of 0.060%).
| Demographics | Rating | Rank | 1 or more Vehicles in Household |
| Lithuanians | 99.7 /100 | #70 | Exceptional 91.7% |
| Poles | 99.7 /100 | #71 | Exceptional 91.7% |
| Cajuns | 99.7 /100 | #72 | Exceptional 91.7% |
| Immigrants | Iran | 99.7 /100 | #73 | Exceptional 91.7% |
| Immigrants | Lebanon | 99.6 /100 | #74 | Exceptional 91.6% |
| Portuguese | 99.5 /100 | #75 | Exceptional 91.6% |
| Cubans | 99.5 /100 | #76 | Exceptional 91.5% |
| Immigrants | Philippines | 99.4 /100 | #77 | Exceptional 91.5% |
| Iranians | 99.4 /100 | #78 | Exceptional 91.5% |
| Immigrants | South Central Asia | 99.4 /100 | #79 | Exceptional 91.5% |
| Bolivians | 99.4 /100 | #80 | Exceptional 91.5% |
| Immigrants | South Eastern Asia | 99.3 /100 | #81 | Exceptional 91.4% |
| Lebanese | 99.3 /100 | #82 | Exceptional 91.4% |
| Immigrants | England | 99.3 /100 | #83 | Exceptional 91.4% |
| Jordanians | 99.3 /100 | #84 | Exceptional 91.4% |
Demographics Similar to Jamaicans by 1 or more Vehicles in Household
In terms of 1 or more vehicles in household, the demographic groups most similar to Jamaicans are Soviet Union (82.7%, a difference of 0.64%), Immigrants from Cabo Verde (81.6%, a difference of 0.67%), Immigrants from Belarus (83.3%, a difference of 1.5%), Immigrants from Ghana (83.4%, a difference of 1.6%), and Ghanaian (83.6%, a difference of 1.8%).
| Demographics | Rating | Rank | 1 or more Vehicles in Household |
| Albanians | 0.0 /100 | #314 | Tragic 84.4% |
| Cypriots | 0.0 /100 | #315 | Tragic 84.4% |
| Alaska Natives | 0.0 /100 | #316 | Tragic 83.8% |
| Ghanaians | 0.0 /100 | #317 | Tragic 83.6% |
| Immigrants | Ghana | 0.0 /100 | #318 | Tragic 83.4% |
| Immigrants | Belarus | 0.0 /100 | #319 | Tragic 83.3% |
| Soviet Union | 0.0 /100 | #320 | Tragic 82.7% |
| Jamaicans | 0.0 /100 | #321 | Tragic 82.1% |
| Immigrants | Cabo Verde | 0.0 /100 | #322 | Tragic 81.6% |
| Immigrants | Yemen | 0.0 /100 | #323 | Tragic 80.5% |
| Immigrants | Caribbean | 0.0 /100 | #324 | Tragic 80.4% |
| Senegalese | 0.0 /100 | #325 | Tragic 80.4% |
| Immigrants | West Indies | 0.0 /100 | #326 | Tragic 79.5% |
| Immigrants | Senegal | 0.0 /100 | #327 | Tragic 79.0% |
| Ecuadorians | 0.0 /100 | #328 | Tragic 77.9% |